Hey Forum,
i have a question about the boundary conditions. At my testcase i like to measure the flux over a seperator.
I think the measurement with Paraview works fine. The only problem is, how i get the water away ?
Position of the calculator, the flux and alpha phase 0 - 1.
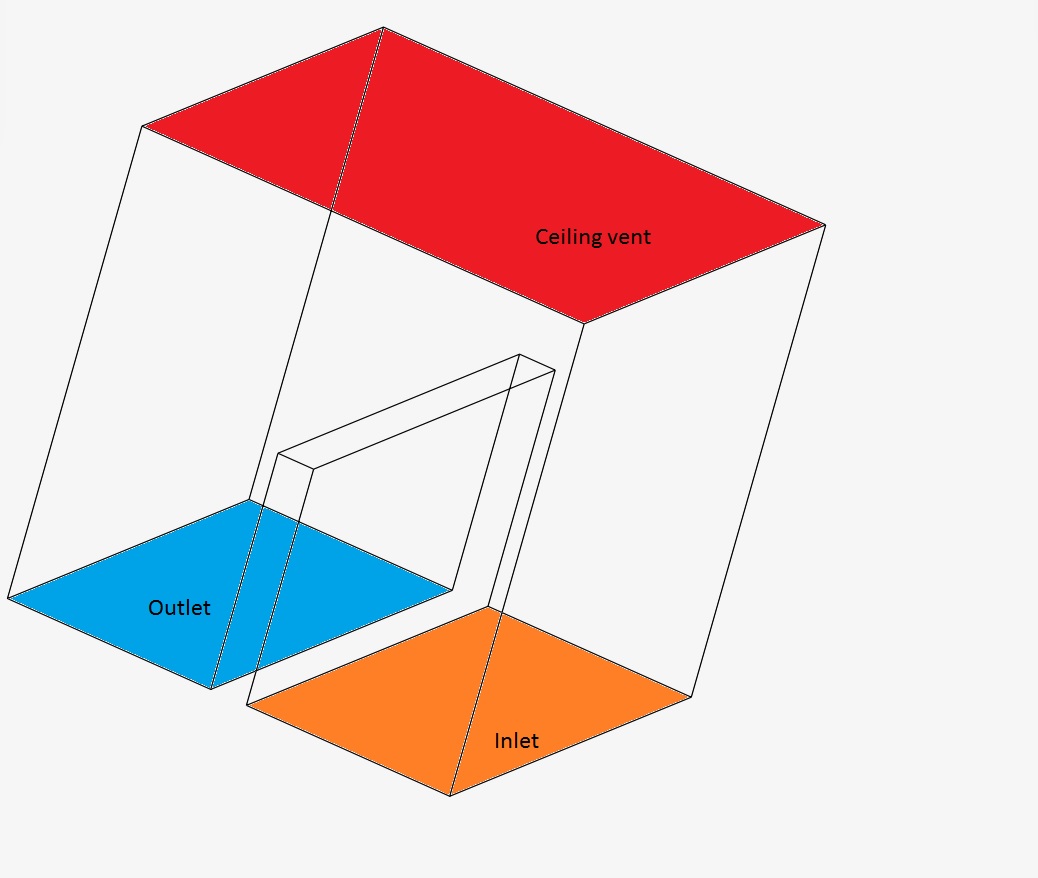
At this system the boundary contition, are only an inlet velocity and a “ceiling vent”.
So the water dont go out of the system. If i simulate longer or a higher velocity rate, the left chamber will fill up with water.
This picture shows the model system and the boundary conditions i want.
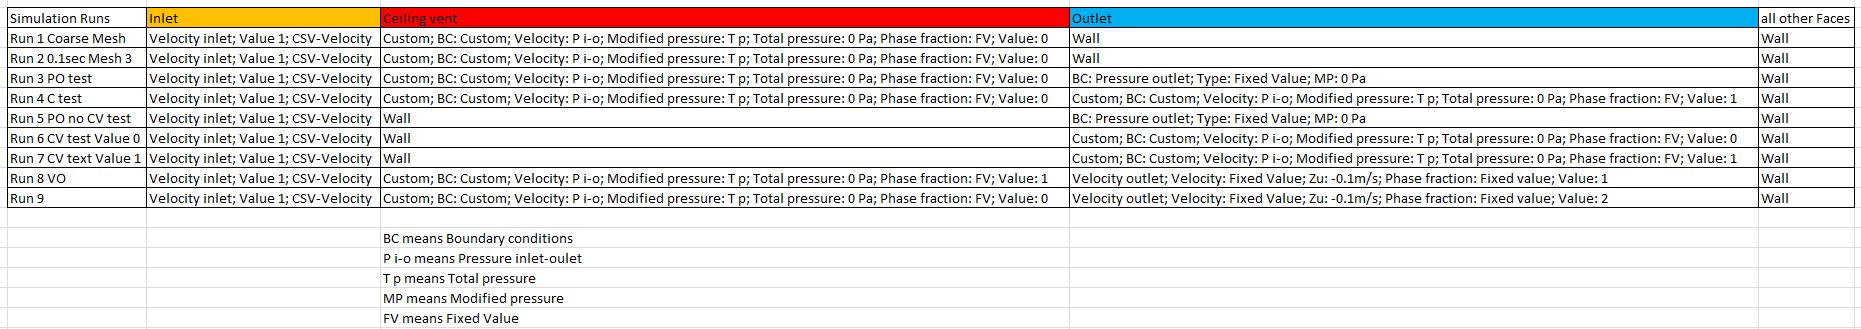
I tried a few sim runs with different boundary conditions, but only the runs without an outlet finished.
The water should leave the model system, it does not have to follow a fixed value, rate or mean flow.
Is this possible with openFoam ?
My attempts are in the excelsheet:
Very cool project! I am no expert in this but as an intuitive approach I would work with phase thresholds and integrate over the surface you have chosen (calculator slice) but only if it is below or above a specific threshold you want to capture. Does that make sense? Never done this before maybe the @cfd_squad can put in their ideas here
The error message you are getting mentions possible bad mesh elements and your mesh log does show that there are some bad elements. I am a little surprised actually as the geometry is very simple and mesh looks OK. You can try increasing mesh fineness to moderate and adding a boundary inflation (i.e. make the mesh at the edges finer) under mesh refinements.
@jousefm,
Hey Jousef and Hey roy_g,
yes you are right. To “filter” the alpha phases i used a threshold. At my test, i have noticed something i cant explain.
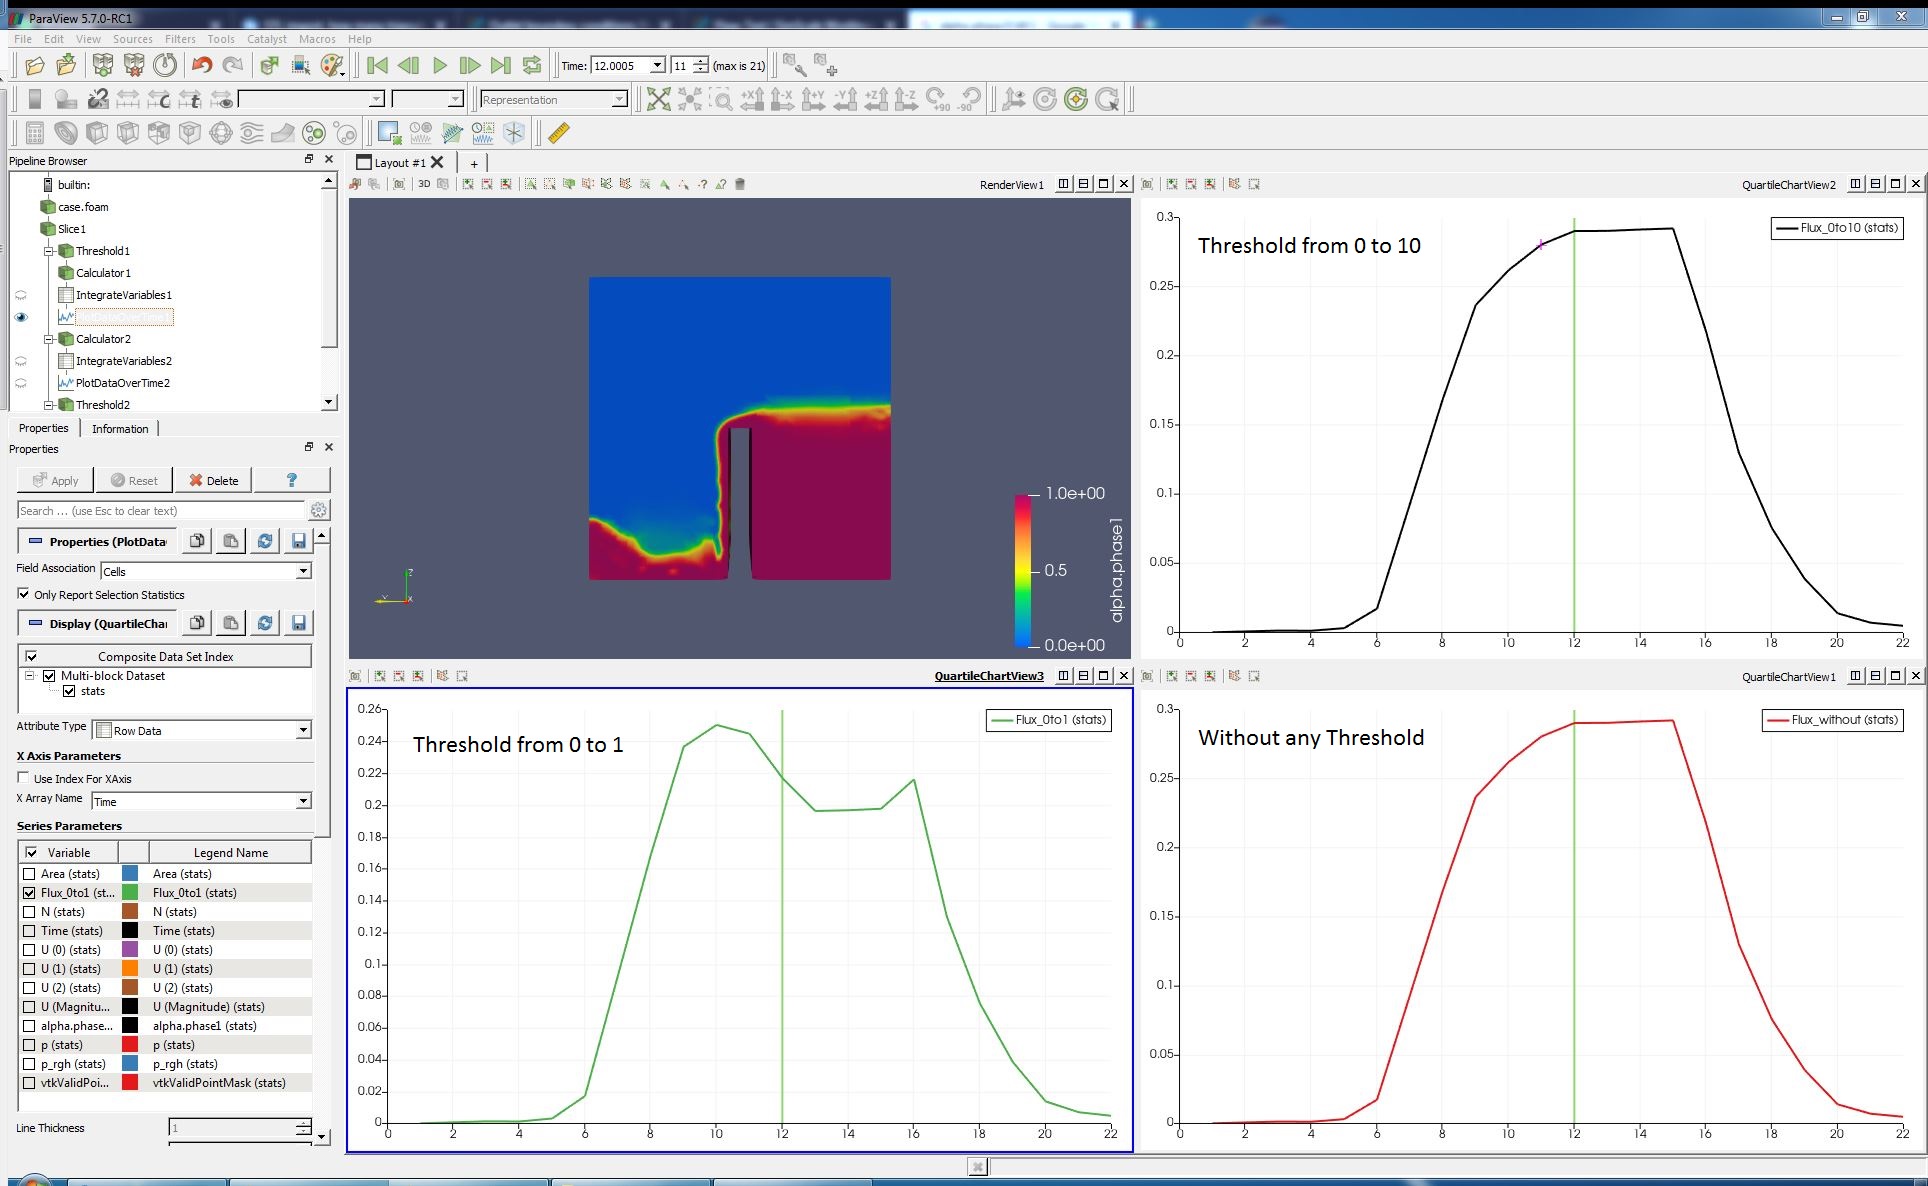
So far i have always thought, that the alpha phase 0 represents Air and the phase 1 represents Water (in my simulation). I made three LineChartViews about the flux over the seperator.
One without any threshold, one with a threshold from 0 to 1 and one with a threshold from 0 to 10.
I think the flux over time is shown correctly in the ChartView without any threshold and from 0 to 10.
Why is the flux different, when i choose 0 to 1 or 0 to 10, i think 0 and 1 are the boundarys for the alphaPhase. What “filters” the threshold when i choose upper bound as 10 ?