New Mesh Quality Feature!!!
So i just wanted to show some features i am discovering in the new mesh quality feature for identifying problems in the mesh. This feature should help significantly with understanding mesh settings and their connection to quality controls.
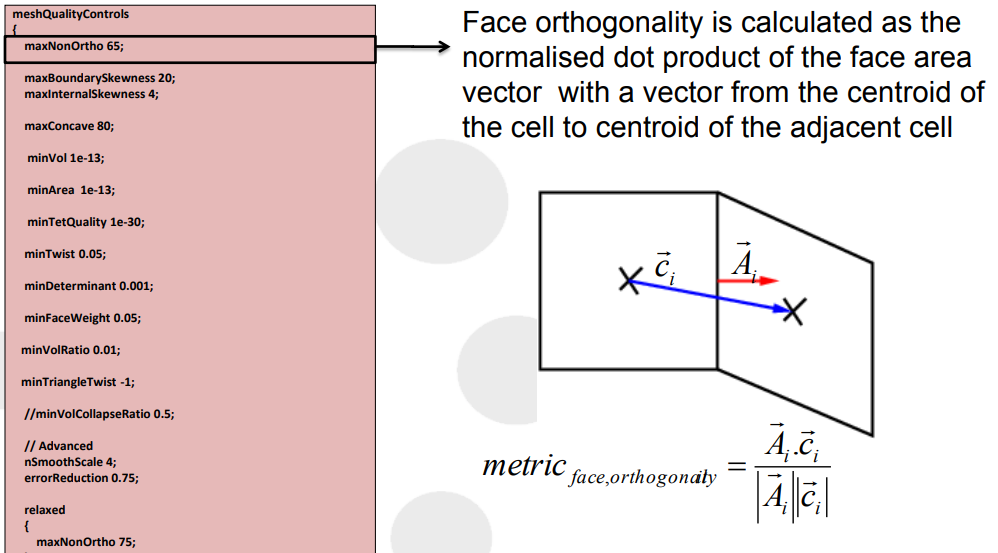
The first thing I wanted to check was non-orthogonality in my mesh.
My Quality settings for this run were:
MaxNon.Orthogonality - 75°
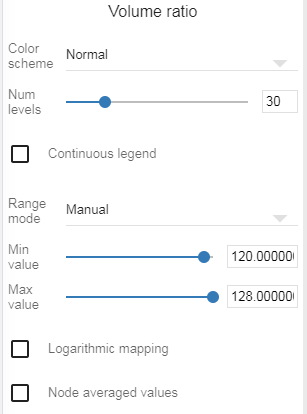
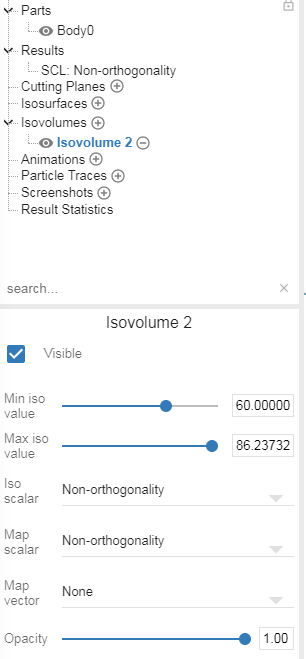
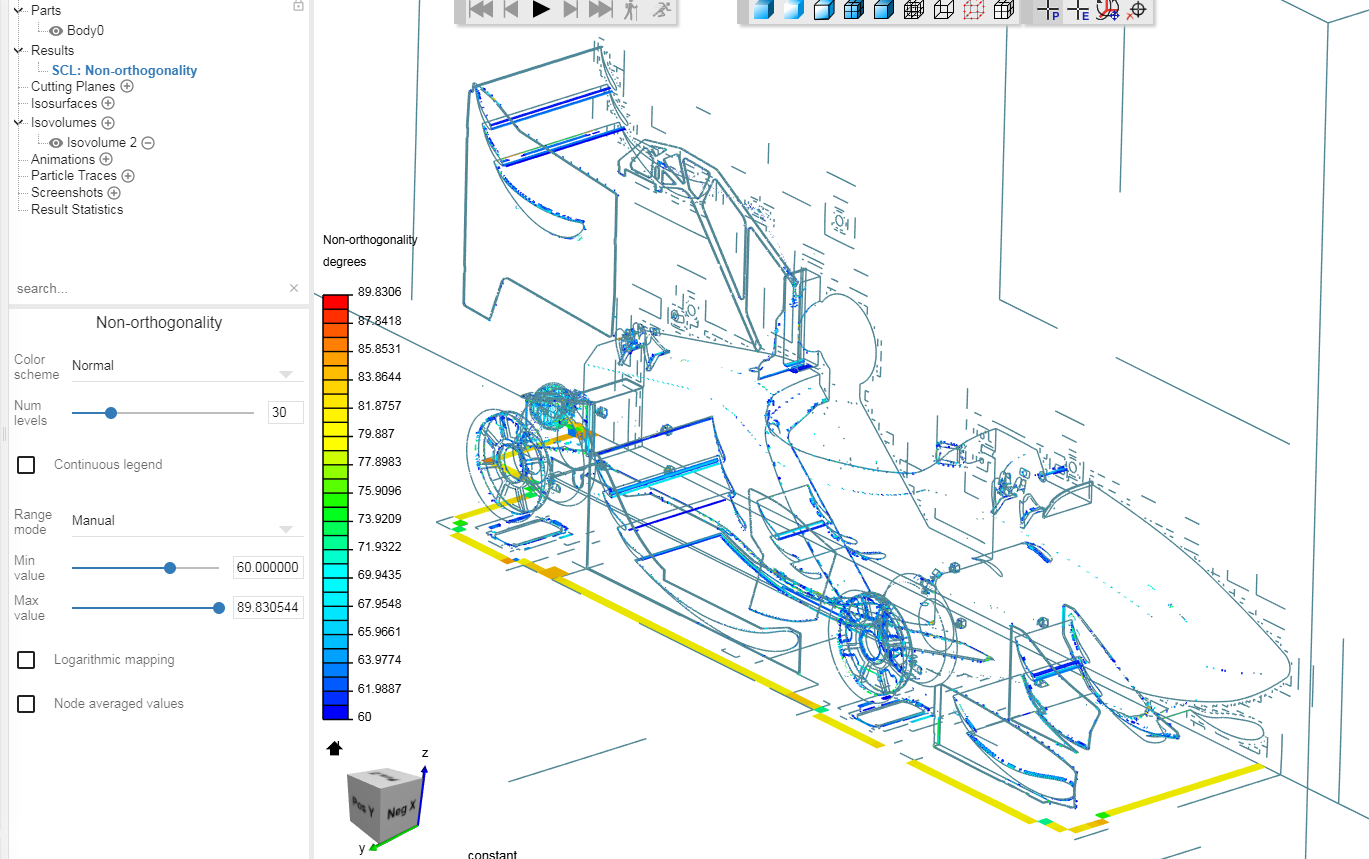
Setting up the mesh quality solutions field, I selected Iso volumes then set both ISO and MAP scalars to Non-Orthogonality. Then, the max iso value can be found with the slider all the way to the right. This should be the highest Non- Orthogonal cell in the mesh. The lower limit i set to 60 so that I could see a more concentrated area of cells.
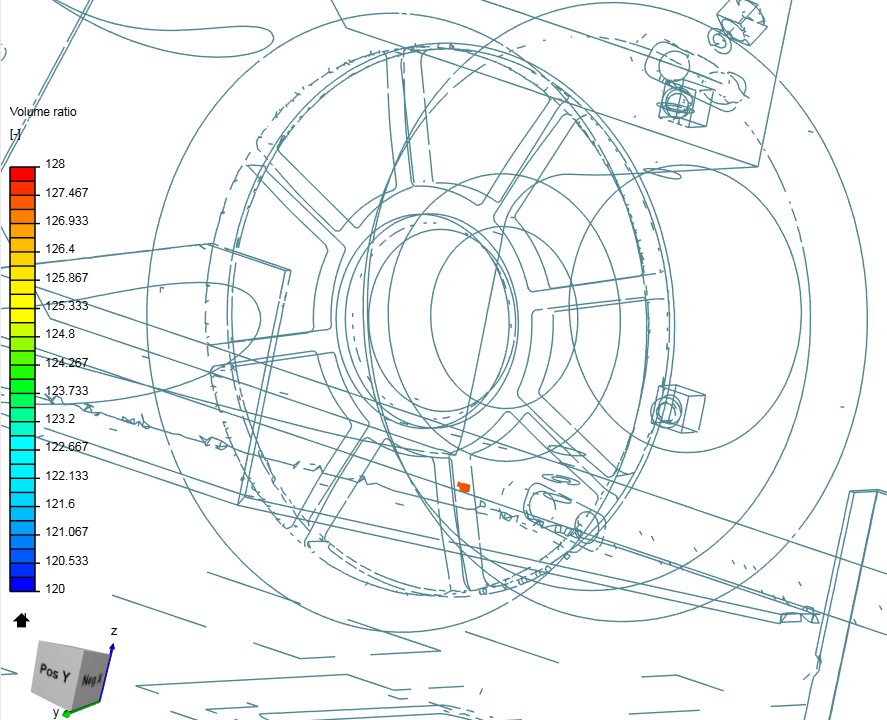
Moving to the results tab, the min and max values were set to the same as the ISO and MAP scalar limit range. This gives us a nice overview of where the problems are. Generally, Values under 70 are acceptable for simulation. In the picture below, I clearly have some areas that do not meet this requirement and will cause problems later. These visuals help to show if the problem lies in CAD geometry or Mesh refinement selection. In this case, it seems that one section for improvement is where my region refinement box is intersecting with the floor. This could be a problem with the bounding box layer addition.
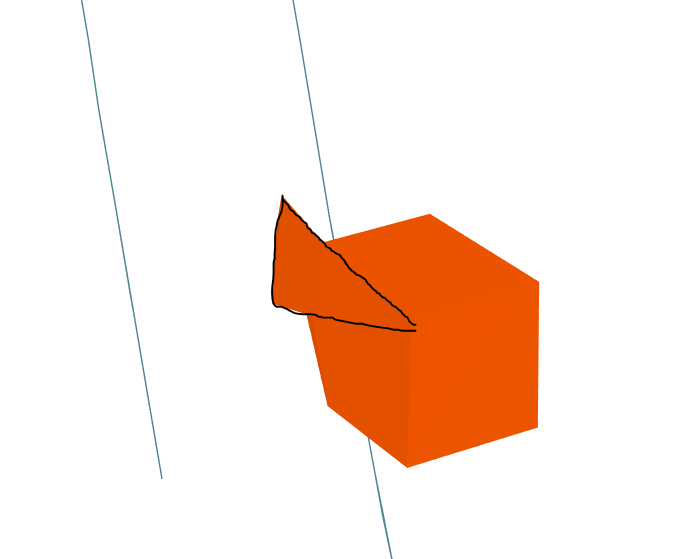
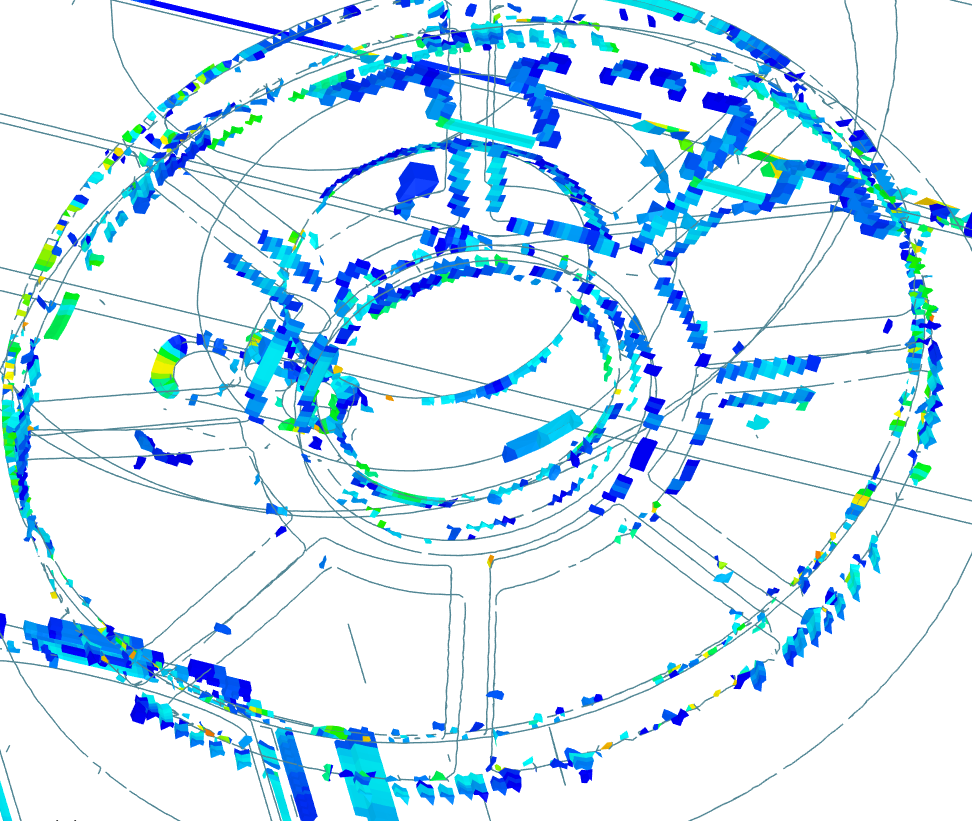
Zooming in we see there are quite a lot of non-orthogonal cells in the 60-86 range in the wheels as this is a fairly complex geometry. There are some local spots over 70 but this could possibly be fixed by lowering my Max Non-Orthogonal mesh control value to from 75 to 70.
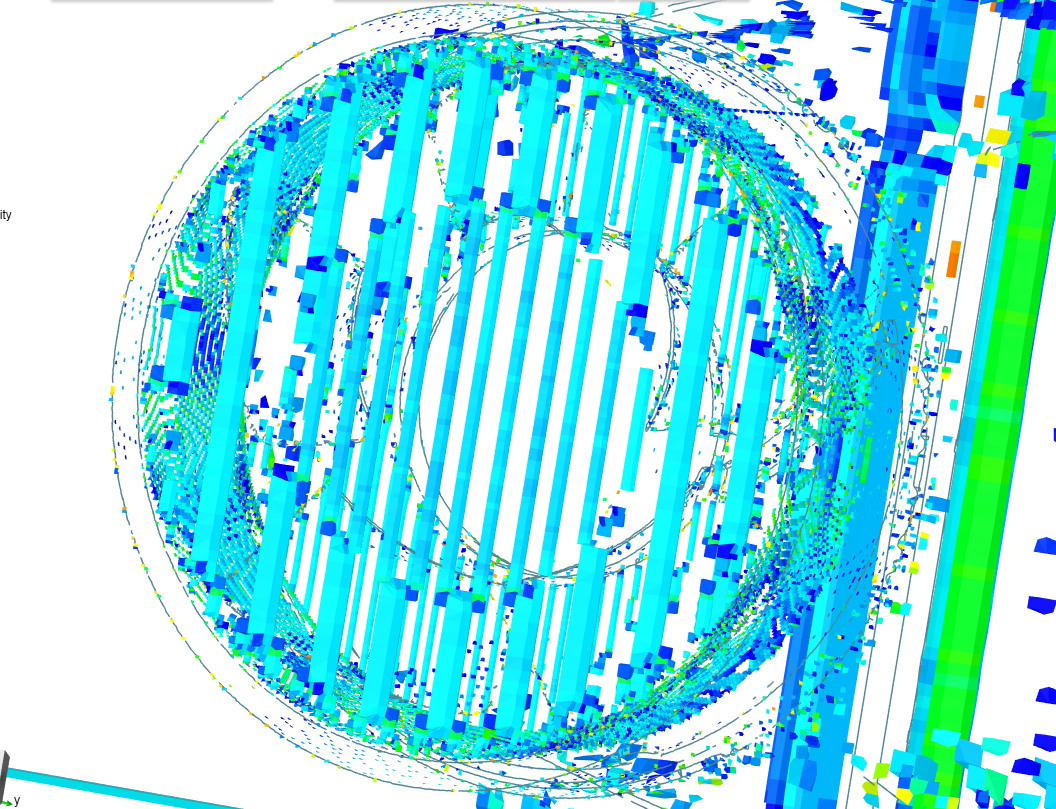
The next hotspot is in my fan setup. I am using a Porous Media with an exhaust vent connected to a rotating radiator fan assembly with a MRF zone. This is a very tight area and has a very high refinement level compared to the rest of the car. Since this geometry would be very difficult to improve without going over my Total cell count limit, I would hope that this area would also benefit from the Max Non-Orthogonal mesh control value change to 70
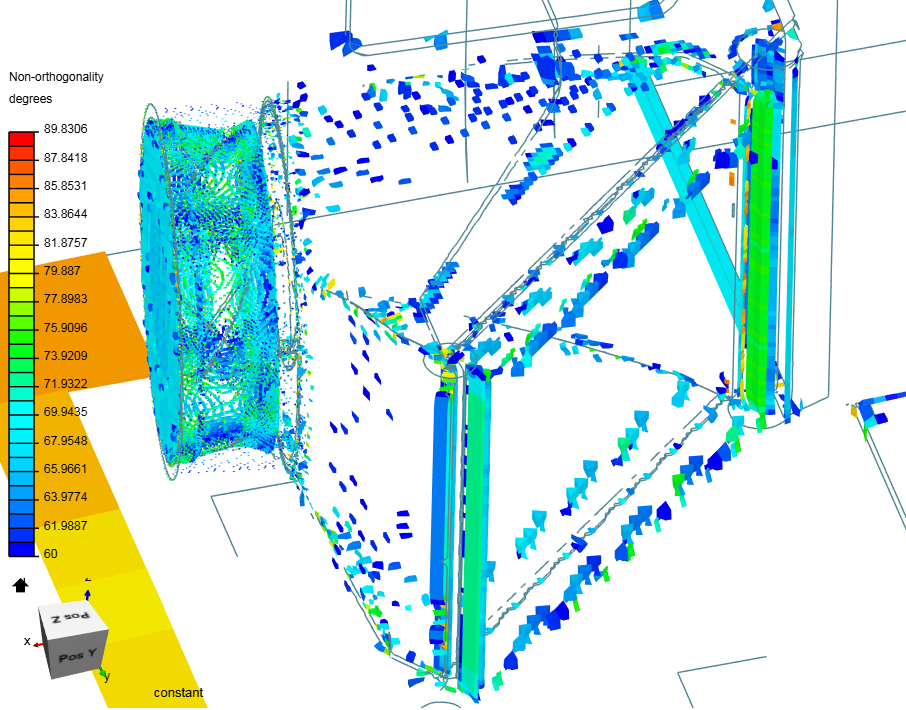
The last area of improvement would be from the vertical tubes on either side of the porous media. Since the whole area is showing a higher value of about 75, this section could see improvements from changing the CAD geometry.
For more info on the SnappyHEX mesh process I found this a good source of information especially the following information:
During a run of snappyHexMesh the mesh quality is constantly monitored. If a mesh motion or topology change introduces a poor quality cell or face the motion or topology change is undone to revert the mesh back to a previously valid error free state The mesh quality metrics used for the checks are set in the subdictionary meshQualityControls
Please add to this post/ fix anything i have done wrong!
Dan