Mesh Independence Study - Layering disappears across study meshes

NEVER any reason to apologize for response time with me. I just carry on, but I try to stay organised by creating new posts when I carry on rather than post edits (sometimes I edit :wink:). I am sorry if that seems like I am pushing, I am not , I am just trying to stay organised.

You have provided me with much help and guidance which has provided much advancement in the ‘education of Dale Kramer’, thank-you.

I have lost all track of time in the last month and it must seem that I am on a madmans schedule, but in reality I have no schedule. I have just been wanting to use FEM for so many years and it looks like now is the time. :smile: Such has been my life, watchout when I commit to something.

My single solid geometry is as clean as I can make it, I am hoping that is not the issue.

My geometry is refined as simply as I can think of with a Background Mesh Box generously sized (I think anyways :wink:) . The method was, one region refinement encompassing the whole plane plus a few feet, one surface refinement on all surfaces to a single level (where Min level=Max level) close to the last layer thickness and then a 3 layer layering to a yPlus of 160.

On SRF3, my Level 0 cell dimension was about 14 in. x 14 in., which makes Level 7 at 0.111 in. square. My 3 layers had a final layer thickness for yPlus =160 of 0.107 in. (using reference length as the length of the whole aircraft).

Here you can ‘see’ that my region box was Level 3 refinement and the ‘All surfaces’ refinement was to Level 7 (I think the cells added during layering also show up in level 7 quantities below for some reason):
SRF3-cells_per_level

As far as where to go next…

I will research what the SnappyHexMesh quality checker looks for and try to get ‘fourth’ and 'leastSquares’to converge and then see how those options handle my mesh in a full study spread. In addition, I will likely run a study spread on the already converging cellLimited leastSquares scheme (Test #4).

Now back to bed for me :upside_down_face:

Dale

1 Like

Well, it has been a few days and a lot of work but I have made some progress.

First, it was very difficult, as Barry had suggested, to make any sense of what mesh anomalies may cause that annoying little ‘Mesh Operation Event Log’ message that says ‘Mesh quality check failed. The mesh is not OK.’

I was only able to make 2 of the 5 meshes in my new SRJ study series meshes pass that, not very well documented, Quality check (SRJ1 and SRJ3).

Notwithstanding the fact that only two of my five SRJ meshes are ‘OK’ per the quality check, I believe that my new SRJ series of study meshes must be better quality than the SRF series of the last study that I have shown. The reason I say this is because I was able to get 4 converging ‘leastSquares’ gradient scheme simulations and 1 converging ‘fourth’ gradient scheme simulation from them. I was not able to get any of the previous ‘Not OK’ SRF meshes to converge with ‘leastSquares’ or ‘fourth’ gradient schemes.

In the below presented SRJ study, I am still not happy that Total Drag continues its downward trend. In fact, Total Drag also goes down about 5% for each of the last two increases in mesh number of volumes for the ‘leastSquares’ gradient scheme.

Barry, these results indicate to me that discretization schemes are NOT the likely the cause of continued divergence in the results, specifically Pressure Drag. I say that because ‘leastSquares’ Total Drag follows ‘Gauss Linear’ Total Drag in the same downward trend. Any other ideas?

Here is the SRJ Mesh Independence Study:

Here is how I was able to increase the quality of the SRF meshes to reach that of the SRJ meshes:

  1. Set ‘Min tetrahedron-quality for cells’ to 6.1e-9. The default for this parameter is -1e+30, which actually turns off this quality assurance parameter. I am not sure why the default is off, other than it is ‘easier’ to layer a mesh with it ‘nearly’ off (see here). The problem is that with this parameter OFF, I think that leaves cells of low quality in the mesh, which in turn may generate the ‘Not OK’ quality failure notice and reduce the accuracy of your results. I think it is worth the time to refine the mesh better before you layer it rather than band-aid a layering failure by turning off this quality assurance parameter.
    As far as why I chose the value I did, well, I tried values on both sides of this but I felt this was the highest value that reliably left my SRJ3 mesh quality notice as ‘OK’. I think this value may need to be tweaked further, probably on an individual mesh basis.

  2. Although #1 could likely have increased the quality of my meshes enough by itself so that higher order gradient schemes would be more likely to converge, I found a units discrepancy that I chose to fix for the SRJ mesh series.
    The default value for the parameter ‘Min cell volume [in³]’ is 1e-13 while the same parameter in a project with SI units ‘Min cell volume [m³]’ is also 1e-13. I made the assumption that the correct default was the SI units value.
    Therefore I converted 1e-13 m^3 to 6.1e-9 in^3 and I used this as my value for ‘Min cell volume [in³]’
    I think this is a significant discrepancy and I hope someone looks into it…

Also, as an aside, I have discovered a Snappy meshing characteristic that disturbs me. If I make a Copy of any mesh, delete its result and then re-run it with the exact same set of parameter values, I end up with a mesh with a different number of cell volumes. I believe this can have many serious implcations and I have not really thought it through yet but does this concern anyone else???

Dale

Hi @DaleKramer,

As always, great work done going through the nuances of getting the mesh quality check passed and posting the approach on how to achieve it. Its a great contribution to resolving future problems with the mesh for sure.

Odd. In that case maybe the schemes are not the issue. Tough to think of what could be the possible issue again. Are you able to share the convergence plots (if they are not the same as above) and the results control for the meshes where the quality check is passed and you have managed to successfully simulate them both for the first and higher order schemes? I need a little bit more information at this point.

Ah yes, a previous user has experienced this issue as well. While I do not have a definitive answer to this problem of why it happens, I think I gave a hypothesis that due to SnappyHexMesh being iterative, the more complex the geometry the more prone it is to diverges in the final mesh. I may be completely wrong and I probably will look into it if it starts really affecting my results. The implications of this are still not very well understood by me and I quick search seems to not yield any valuable answers to this issue. I would assume there would be result differences, but at the level I’ve mostly worked at, the difference is not significant enough to warrant a need to resolve such an issue.

Looking forward to your reply.

Cheers.

Regards,
Barry

1 Like

@Get_Barried

Thanks for the encouragement!!

Here are Gauss limited convergence plots:

Here are the leastSquares convergence plots:

Here are the fourth convergence plots:

My brain continues to think that since we are having Pressure Drag anomalies in the Mesh Independence Study, that the red peak in the Ux (the direction of Pressure Drag) is related to the anomalies.

Under that premise, perhaps it is a turbulence issue because a slight cyan dip (k value) precedes the red peak.

The cyan dip and red peak are present in ALL convergence plots.

Any ideas on how to get rid of the cyan dip and red peak?

Otherwise, do these plots help you see a road to continue on to track down these Pressure Drag anomalies?

I do think that I will start considering all meshes as unique items since I can never exactly reproduce them.

I can not think of an iterative reason that they would be different. I assume each time they are run with the same parameter values, that they are using the same mathematical precision and formulas so that each calculation should result in the same decision based on the calculations result.

Anyway, since even a few bad cells could cause a ‘hole in the dyke’ that good results could flow through, I am concerned.

I think that we should start a new ongoing topic for this, what do you think?

Dale

Only the SRJ3 mesh, that passed the Quality Test as ‘OK’, converged with more than the Gauss limited scheme.

The ‘OK’ SRJ3 converged further with only the leastSquares scheme (diverged with ‘fourth’ scheme).

Is this what you mean by its ‘results control’ (of the SRJ3 mesh):

Thanks,
Dale

Hi @DaleKramer,

Thanks for the posts on the convergence plots. I will only consider those that have either converged or reached the simulation end time. Plots like the second figure top left (R1 1 35mph 0aoa SRJ1 leastsquares) and almost all of the fourth plots except the bottom left R5 134 mph 0aoa SRJ4 fourth) are diverged and the results obtained from those cannot be used. Further adjustment may be needed in the meshes or numerical parameters in order to try to get these plots to converge. We’ll work on them probably later as higher order schemes don’t seem to yield the result behavior we expect.

If you look at the plots that do converge, we see acceptable margins for convergence even for the residuals of Ux. The residual that does not converge as well tend to be the pressure (p, yellow) and this is usually due to the mesh and how the velocity interacts with the mesh itself from what I’ve experienced. However, some simulations do give good convergence for that value and the ones that don’ t converge as well are also of acceptable convergence.

Side note, what we deem by convergence is typically having the residuals at 1E-4 and below. Ideally everything would be 1E-6 or below but 1E-4 is deemed loosely converged. We can probably set a reasonable limit of 1E-5 as the acceptable convergence margin that we’re looking for.

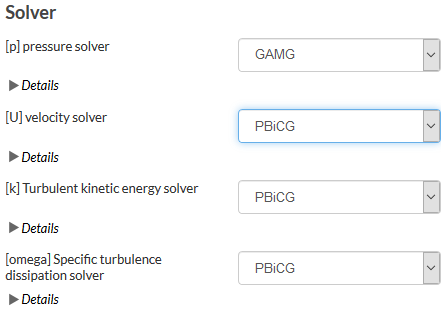
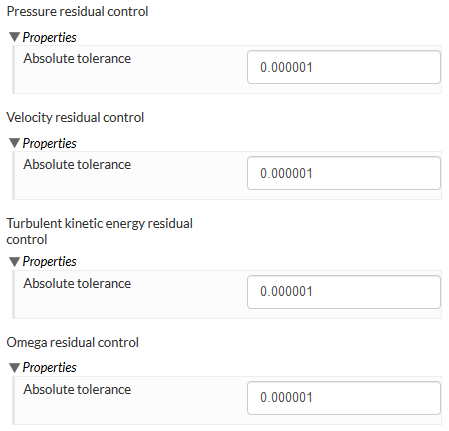
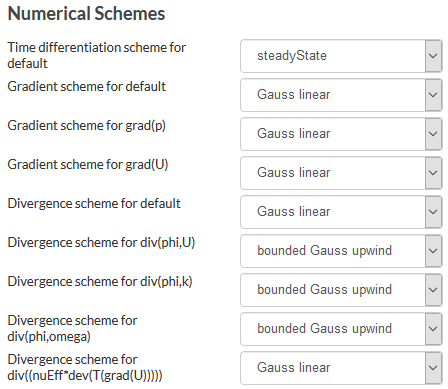
So, here is what I think we can try. Definitely we should try to get the results to fully converge first then get them below our arbitrary set limit of 1E-5. I suggest picking two of your best meshes (probably the SRJ4 and SJR3 or something, you can determine this), performing a first order simulation with the default solver schemes and adjusting the residual controls for pressure and all corresponding residual controls to 1E-6. I’ve attached screenshots of the default parameters you should adjust to below. Once this is done, increased the simulation end time to 2000s and post the convergence plots and result control plots here for those two meshes.

image

image

image

Results control is under the simulation tab and is a way to check for additional convergence while getting a good estimate on the actual values that the simulation is obtaining. You’ve already posted a result control in the second set of figures for Leastsquares, its at the top right corner. Do ensure you apply this result monitoring for both the meshes that we’re going to simulate again so we can monitor them.

After we get steady-state convergence, aka when the residuals or the result controls have reached a steady-state, we can work on bringing any less than preferred residuals down to our set limit. We will probably do this by adjusting the relaxation factors, but that will entail a longer simulation end time so we will deal with that later. Provided that of course whatever we just did to get-steady state results do not simply resolve our continued divergence in results.

The possibility of small issues in meshes causing large deviations in results is very well possible. Whether it is worth it for the user to spend significant amount of time refining their meshes or troubleshooting in order to negate this discrepancy may be debatable based on why exactly this occurs. So yes I would say we should start a topic on this. However, I would like to resolve this issue of yours first before we move on. Then we can spend our efforts tacking the other topic. You are welcome however to start on it if you do have ample free time.

Looking forward to the results. Cheers.

Regards,
Barry

EDIT: On a side note of peculiar issues with the mesher that has not been resolved. I’ve encountered several issues like in this post where the mesh seems to behave very strangely. Maybe we can start a mega-thread (with your observation about each mesh not being the same) and post all the peculiar problems and try to fix or understand them. It would then be very beneficial for everyone once we figure it out and post the solution.

2 Likes

As I realize that this topic will likely be a great help to other new users, I appreciate that you are expanding on things that I now take for granted, thanks :slight_smile:

All of the runs had residuals for convergence set to the default 1E-5.

I’m on it :slight_smile:

I have already confirmed that the issue was not the fact that I had only used Default Initial Conditions for k and Omega. I put realistic values in using a reference length of my fuselage length and got very little difference in force results.

Also, I had already started relaxing trying to converge the SRJ3 mesh with ‘fourth’ scheme, no luck, here is convergence plot for U,k,Omega relaxed to 0.3 (the cyan dip and red peak are gone :smile:) :

Sorry, I was confused when you asked me to provide the ‘results control’ of a mesh rather that the ‘results control’ of a simulation run which I was familiar with.

Here is the sim run results for run ‘R9 135mph 0aoa SRJ3 leastSquares’ (stable to less than +/- 0.5% after 300s):

Thanks, I had not come across this topic. I am am already playing with a copy of his project to see if my layering methods will help. He never did get a 15 layer mesh down to 0.0002 m first layer.

I agree and will add that to my ‘ToDo’ list unless you start one first :smile:

But the problem with mega threads is that it gets very had to follow just the ‘each mesh not the same issue’ if a lot of other issues are being discussed too…

Dale

Here is SRJ3 convergence to 2000s with your numerics:

Here is SRJ3 forces results to 2000s with your nemerics:

Here is SRJ4 convergence to 2000s with your numerics:

Here is SRJ4 forces results to 2000s with your nemerics:

All the results shown vary less than 0.1% between 500s and 2000s.

What are we trying to determine with these plots?

Dale

Hi @DaleKramer,

Thanks for the all the work. Can you can check the results between these two simulations and see the result % difference? Is it significantly different from the behavior we experienced in the results for the other set of results you posted much earlier?

We’re trying to ensure that the simulation has indeed fully converged and that fluctuating trend of the results is not due to the simulation not having enough time to fully converge. At this point I’m trying to pin point which part of the process is causing the continued result deviation.

Cheers.

Regards,
Barry

OK, to be more precise, the average difference between these 2000s results and the ~500s results for the corresponding 8 result values presented in this MIS of SRJ meshes , is only 0.11%. That is, the result values of ‘Pressure Force x’ (Pressure Drag), ‘Pressure Force z’ (Lift), ‘Viscous Force x’ (Viscous Drag), and ‘Pressure Moment y’ (Pitching Moment) for the two 2000s simulation runs.

Dale

Hi @DaleKramer,

What about the result differences for the various parameters(CL, CD, pressure drag etc) between the new sim runs for SRJ3 and SRJ4? Is it still within acceptable margin?

Cheers.

Regards,
Barry

Since the new sim runs were only 0.11% different from what was presented in this MIS of SRJ meshes chart, I believe that just looking at that chart answers that question since the pressure drag anomaly between SRJ3 and SRJ4 was the ~5% reduction that is my main concern about the MIS of SRJ meshes

To be more accurate, my concern is that ~5% reduction and a further ~5% reduction between SRJ4 and SRJ5 pressure drags.

Also, the study presents forces and moments, not coefficients.

Thanks,
Dale

Hi @DaleKramer,

Understood, just trying to isolate the potential issues for the continued divergence of the results. Looks like convergence was probably not the issue. I will have to keep looking around and doing research to figure out other causes for this behavior in the results.

Cheers and thanks for all the effort thus far.

Regards,
Barry

1 Like

Hey @DaleKramer

There are some mistakes in the verification method that you follow. The problems that you have encountered as a result are generally not an issue if you had used a different mesh generation algorithm. Fortunately, there is a way to do proper verification using snappyhexmesh that comes with OpenFOAM.
Before we dive into the details, please remember to avoid ‘halving cell size in one or more directions until results converge to a value’. It is unrealistic.

First of all, you want to locate (as many cells on the wall surface as possible) in the log layer, which is where y+>30, if you are modelling an entire plane. This saves the computation effort, and can actually be done in OpenFOAM.

Secondly, once you have an initial mesh, vary

  1. inlet, outlet, sides, top and buttom boundary locations so that Cd and Cl do not change more than 1%
  2. the number of cells in the boundary layer ( try 3, 4, 5, and 6) until Cd and Cl do not change more than 1%
  3. the size of the first layer, which controls y+, so that Cd and Cl do not change more than 1%. Note that you want to maintain 30<y+<100 for majority of the surface area. If the averaged y+ is 30, then you will have many areas below 30. But if the averaged y+ is 50, then you will get more of them above 30, which is what you want.
  4. the refinement levels around the plane, say level n, n+1 and n+2. Note that you want to keep the refinement levels on the plane surface unaltered for two reasons: 1) RANS does not require a lot of cells. As long as the plane surface is described by the Cartesian surface mesh, chances are you have more than enough cells already. 2) You should use the relative setting in addLayer - it gives you better control over the coverage% on the wall. If you alter the surface mesh sizing, the boundary layer sizing will change as a result, but you don’t want to change more than one parameter at a time. Simply make sure the refinement levels in space are always smaller than the refinement levels on the plane surface.

I have obtained good results with high y+ modelling. See the DrivAer model (different configurations) drag prediction:
image
image

1 Like

Thanks, I have been so frustrated trying to find meshes that supported that method. I was about to give up :relieved:

With regard to points 1-4, it sounds like once I have accomplished these points on a single mesh (no multi-mesh independence study required :smile:) , that I will have a mesh which should provide meaningful CFD results that would compare to experimental results +/- 1 % or so, is that correct?

This does make sense to me and it has some relevance for a different layering issue I am having here.

You have given me renewed hope that I can eventually obtain good enough CFD results to aid me in designing my new aircraft :smile:.

I will implement your suggestions on a new mesh and report back :slight_smile:

Thanks so much,
Dale

@DaleKramer

I hope you get the results that you want. But bear in mind that there is another side of CFD - discretization schemes and linear solver settings. If you still run into problems, share your project here so I can have a look.

1 Like

Look out, I plan to take you up on that offer at some point :smile:

Dale

Before you leave, I am a little unsure of what you mean here. Are you talking the plane surface refinement levels ‘normal’ to flow dimension or ‘along’ the flow dimension?

Dale

@DaleKramer

Sorry my bad. In the refinement settings, you can define refinement levels on the fuselage, the wings, and landing gears, etc. You can also define refinement levels on a box that covers the plane, so that the cells within the box will have at least that refinement level. For example, with a background mesh of 0.5m generated from blockMesh, you can define level 8 refinement on the plane, and level 6 refinement on a box that covers the plane. Now, if you define a level 9 refinement on the box, then the entire plane will also have level 9 refinement, finer than what you need creating a lot of cells.

When doing mesh independency study, you can increase the level of refinement of that box to 7, but you don’t need to increase the level on the plane. If there are areas on the plane that are apparently not described by the surface mesh properly, then you refine it.

1 Like

Ok, so would you consider these ‘space’ refinement levels sufficient for the 15 layer boundary?