Hi all!
I performed a load-deformation simulation on a “dog bone” specimen model. I would need to plot a stress (y axis) - strain (x axis) graph. How can I do?
I tried to import the Post-Process results into Paraview but I can’t figure out how to make the graph.
Thank you
Luca
Hey Luca, can you add the link to your project as well?
Best regards,
Fillia
Hi,
thank you.
This is the link to my project: SimScale
Thank you for sharing!
There is no direct way to get the stress-strain plot, however, it is possible to get a stress-time and a strain-time plot, download the data in two .csv files and combine them externally using a tool like Excel to create the final stress-strain graph. ![]()
By the way, feel free to write your feature request here: Under consideration - SimScale Product Portal | Product Roadmap A direct graph creation would be nice.
Best regards,
Fillia
I’m also attempting to prepare a stress-strain curving using the FEA data and found this post. Where can I find the data suitable for importing into MS Excel. I have downloaded the project I find only *.VTU and *.VTM files. What is the workflow to open these in MS Excel? Thank you. Toby
Hi @tobygloekler,
You can easily get the csv file by going to your result control field and the corresponding data by downloading the file.
The following image might be helpful.
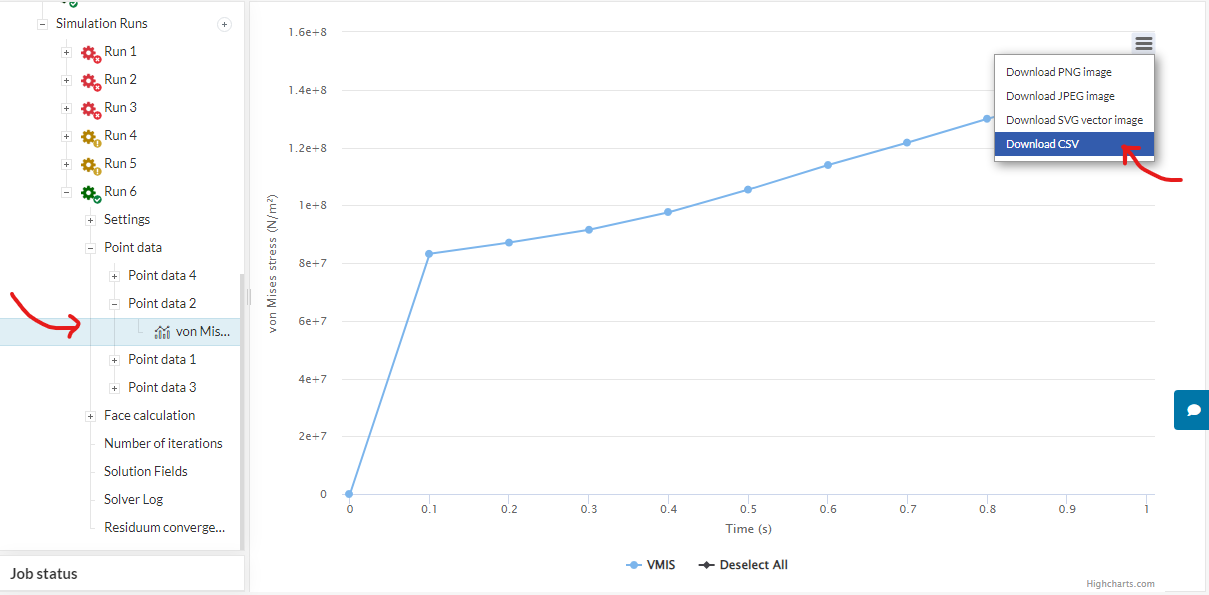
If you have further inquiry, please create a new discussion thread.
That is helpful. Thank you.
thnx