It took a while, but I now have an ORSI by moving average program that analyzes 2D data from the SimScale results plots (for Forces, Coefficients and Residuals)…
It is an extension of my yPlusHistogram program which can now be put into ‘Monitor Mode’…
In this mode, the program monitors the directory, in which the programs’ .exe file resides, for incoming .csv files…
It you have the program in your Browser ‘downloads directory’ and it is in monitoring mode… it will scan the directory every second and look at any .csv files that get put in that directory… If the .csv file is a 2D plot data from SimScale, it will analyze the data using a moving average ORSI calculation and present the results in a pop up window…
You can look at the results from any completed simulation run but the beauty of this program is so that you can monitor sim runs that are ‘in progress’ and then you can stop the sim runs manually when the desired ORSI values are reached…
Some sim runs take many hours and even days to run, so if you can stop them easily when your desired results stability is reached, you can save many core hours…
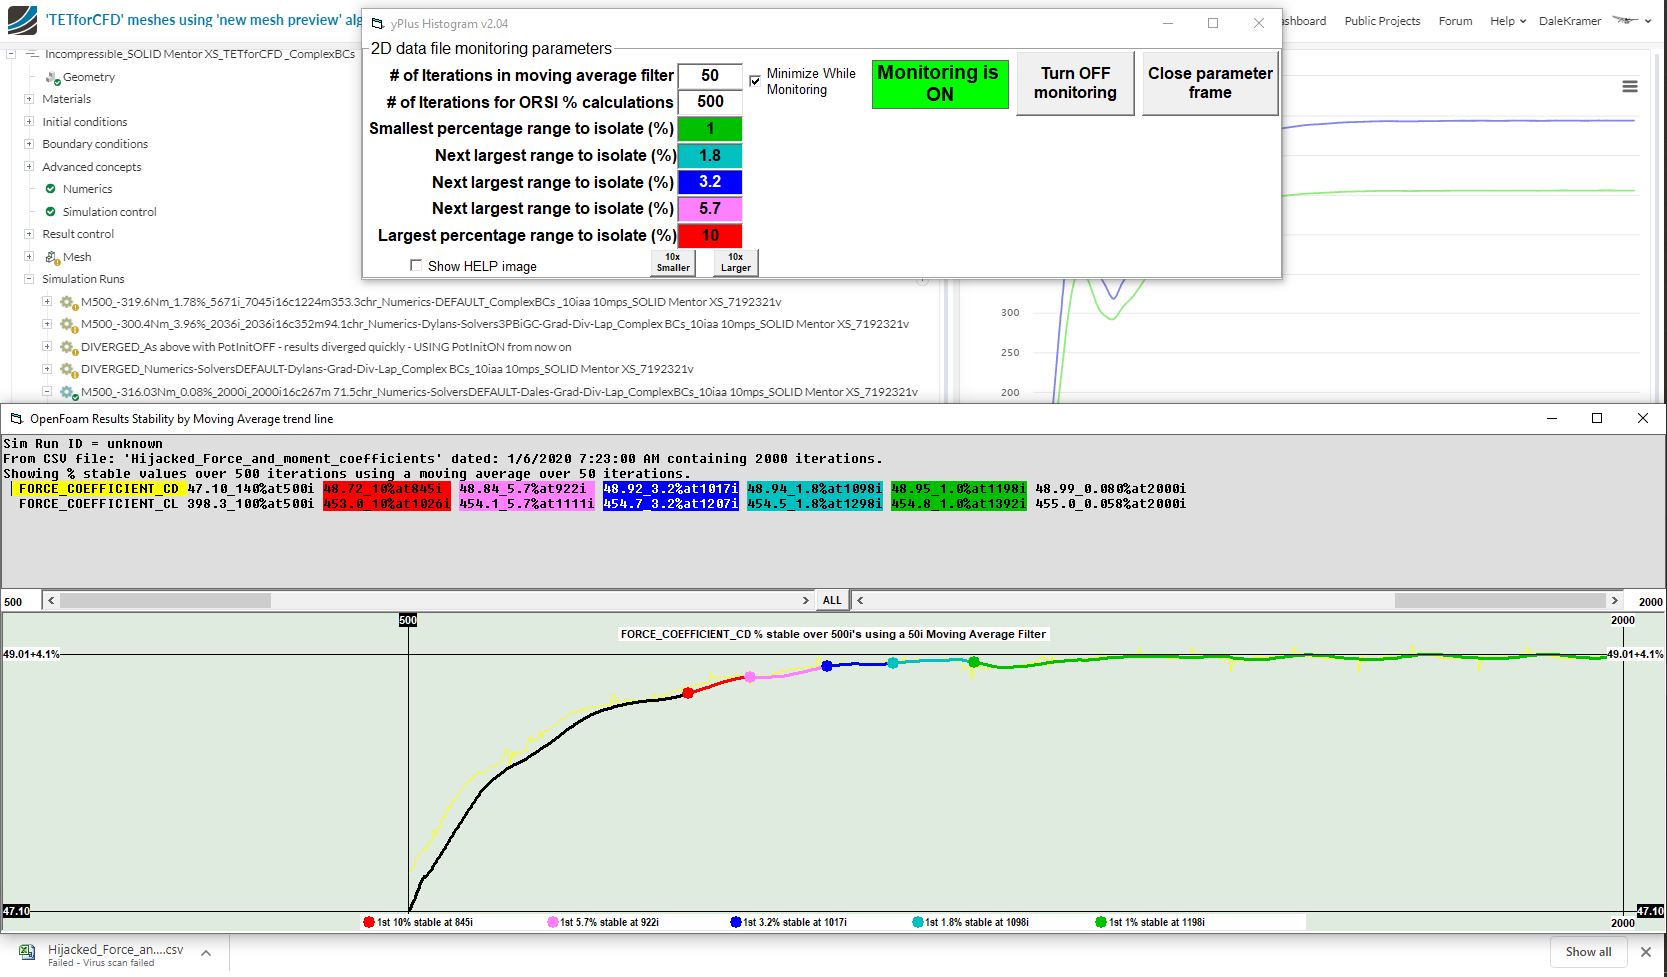
Here is the ORSI by moving average popup window for the sim run of Post #1 of this topic: