To ensure the wall modeling Y+ recommendation is met, we can visualize the first cell Y+ value on a surface. To do this you will need to ensure that converged results run with the Y+ result control added, are downloaded to your local machine and ParaView is installed.
These are the steps to visualize the Y+ on a surface.
-
Open ParaView
-
Open the downloaded case by opening the case.foam file
-
Before applying the settings to import in ParaView, deselect the Internal Mesh in Mesh Regions and select the surfaces of interest (the faces to visualize Y+ on)
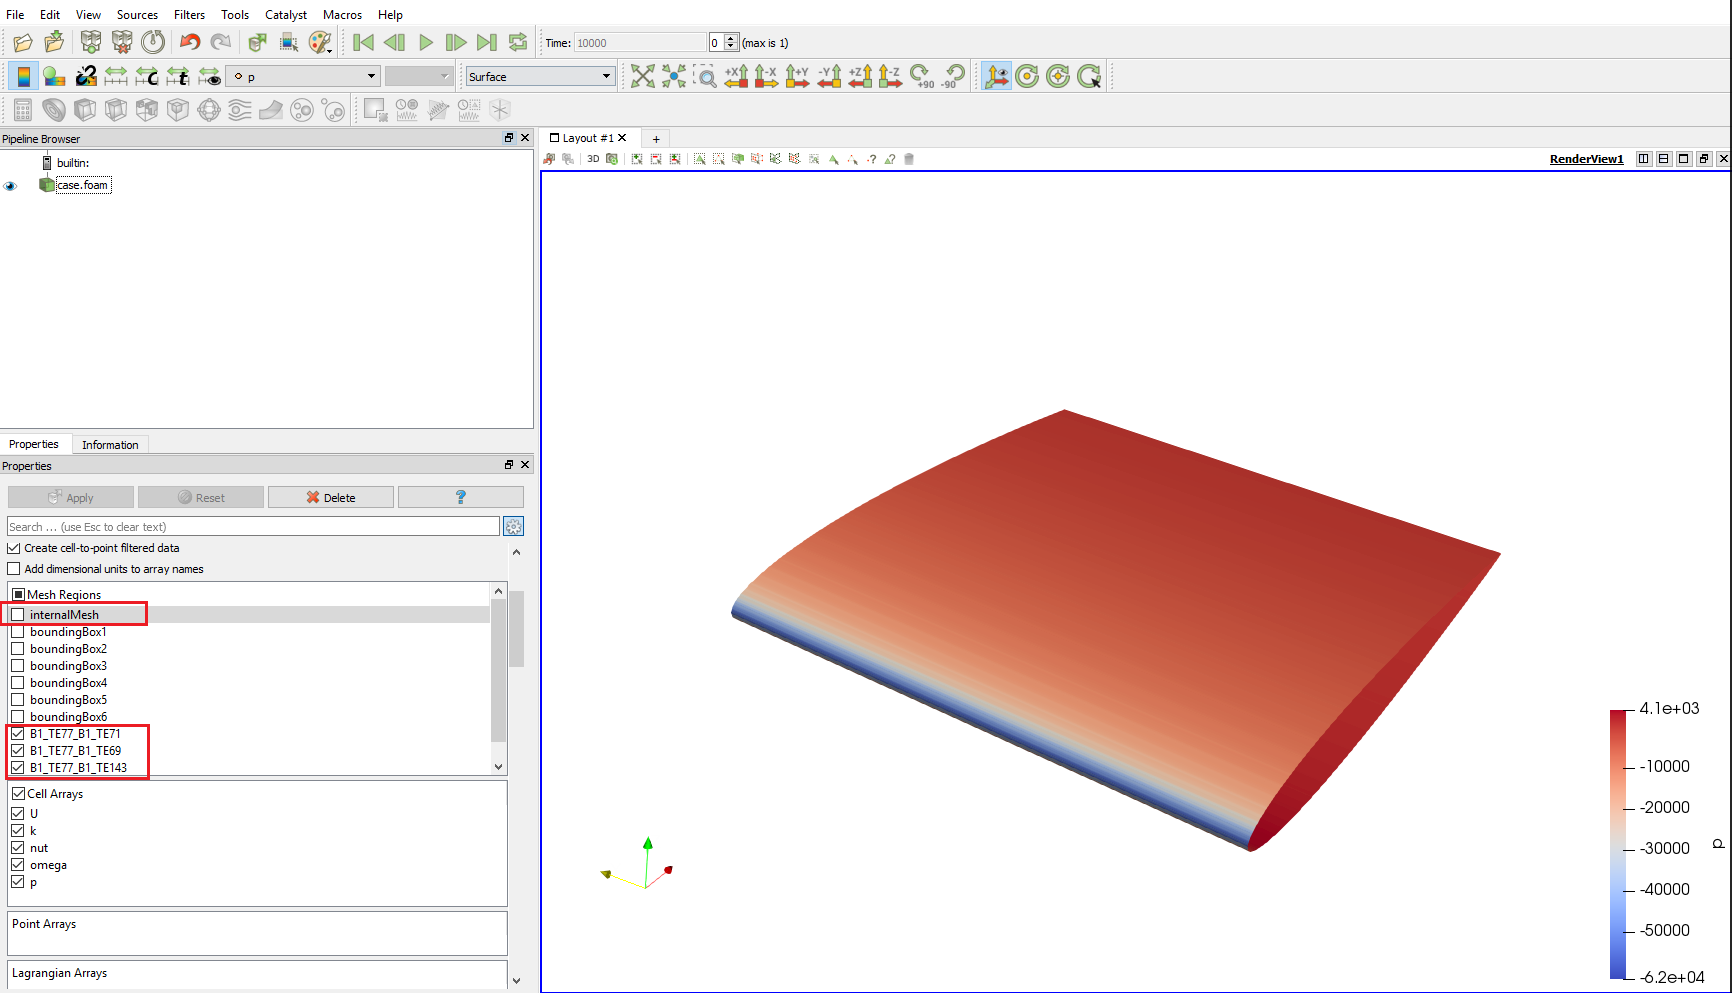
Figure 1: Changing the imported blocks
-
Apply the import settings
-
Change the visualization to Yplus (point data)
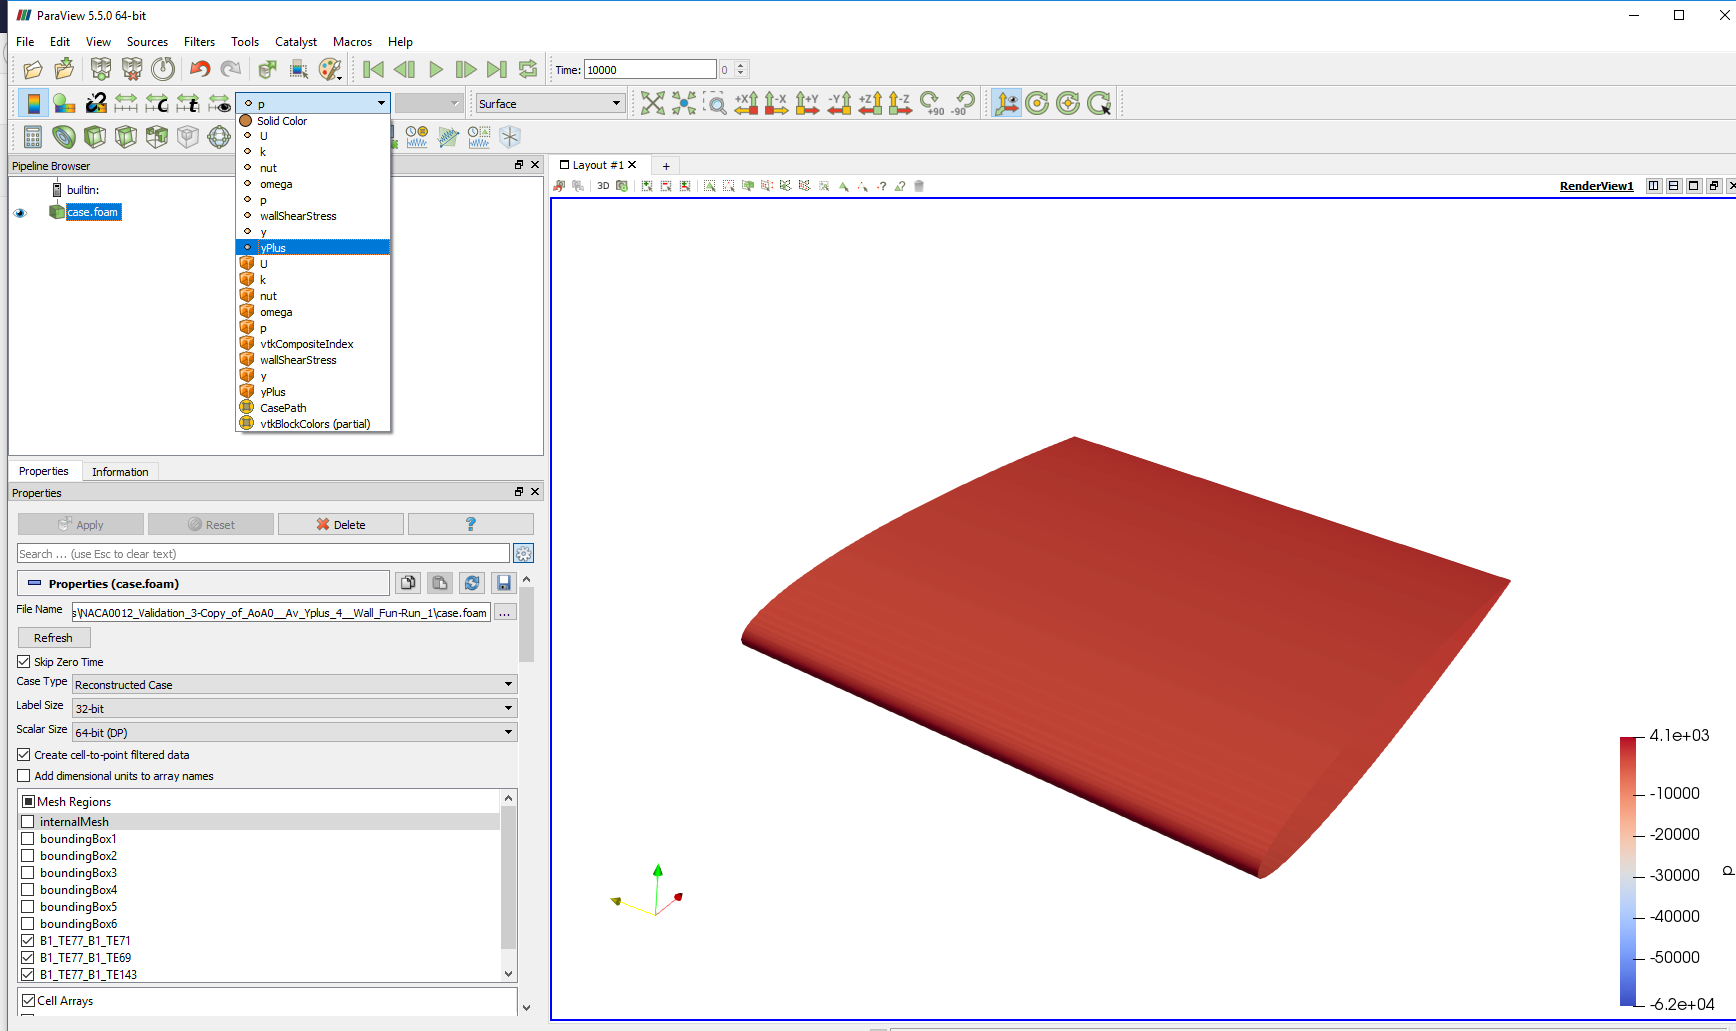
Figure 2: Changing the visualized scalar
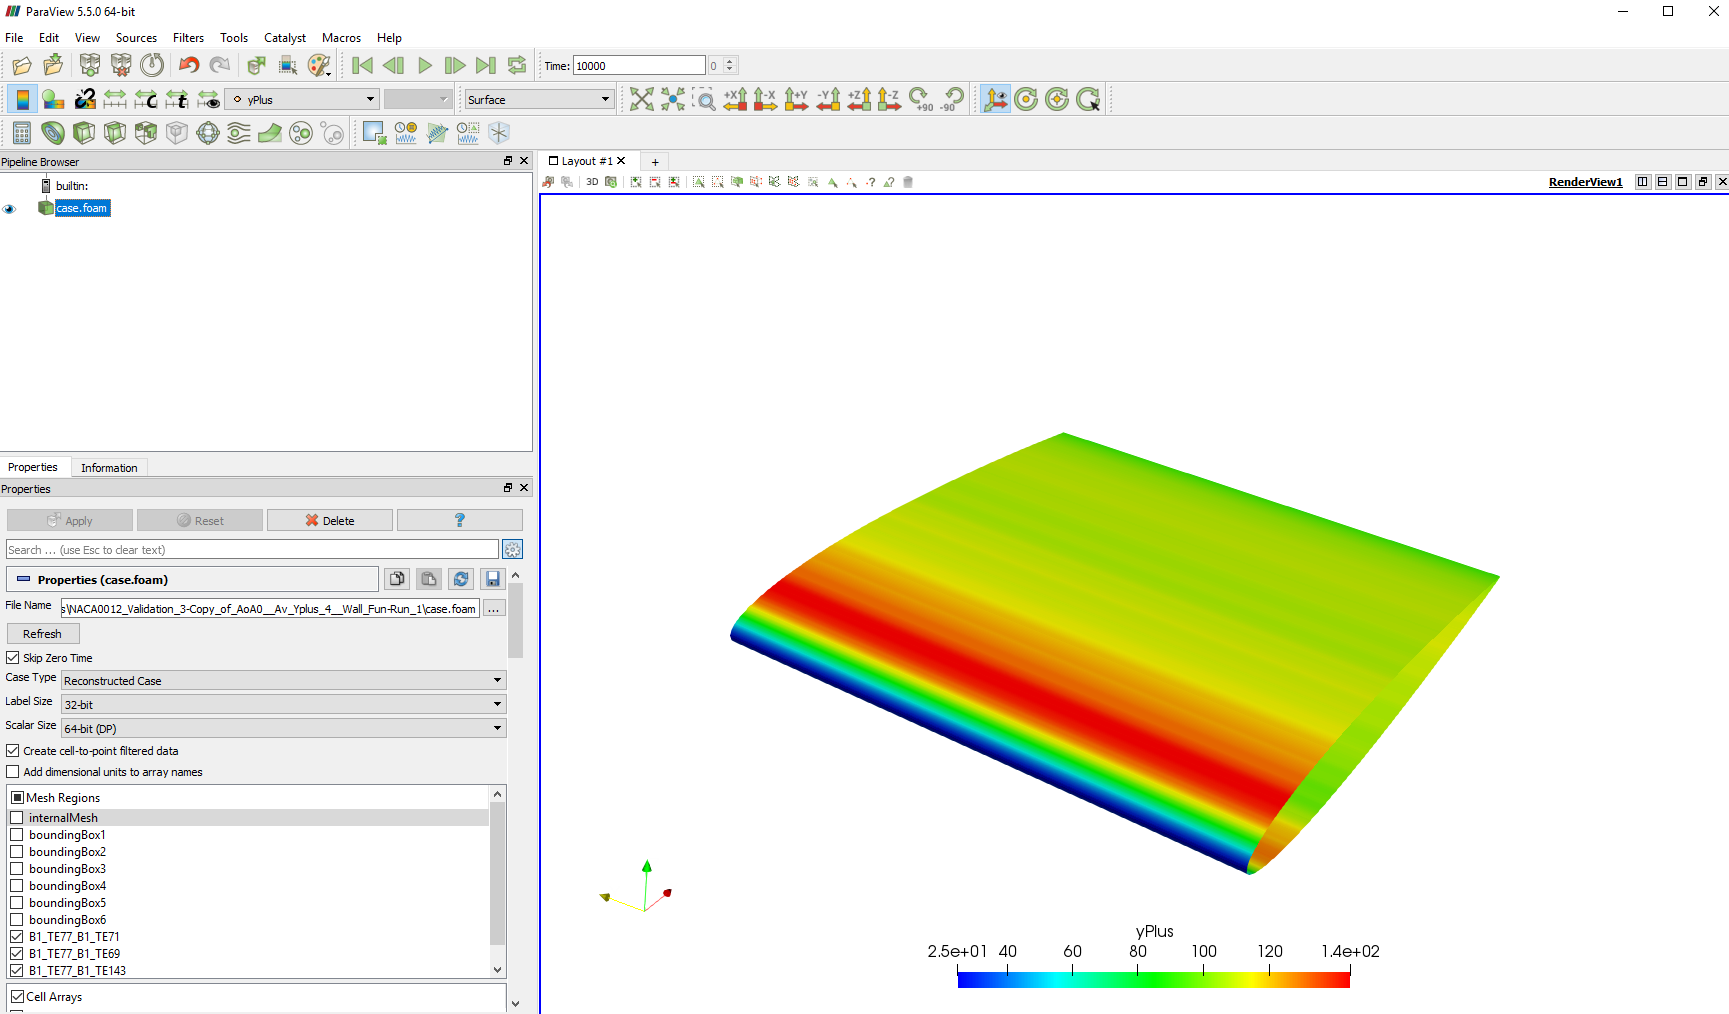
Figure 3: The final visualization