Engineers doing FEA simulation for industrial purposes often have to submit a report to their recipient detailing the simulation set up and the results. The decision of design modification or improvements are then taken based on the results presented. Also, the result can be used for future reference and presentation by your recipient. Therefore, it is very important to write the FEA report accurately in a proper format. This article briefly talks about one such format with a simple example (Workshop 2 Session 2 Homework: Aircraft engine bearing bracket analysis)
A suggested format for writing FEA report is as follows:
Title:
Author:
Report No:
Drawing/Part No:
Summary
Briefly summarise the conclusion of the analysis and key findings. This should be similar to the conclusion but short and to the point.
Introduction
Describe background information about the analysis.
Objectives
Explain what information is required and how this data will be obtained.
Model
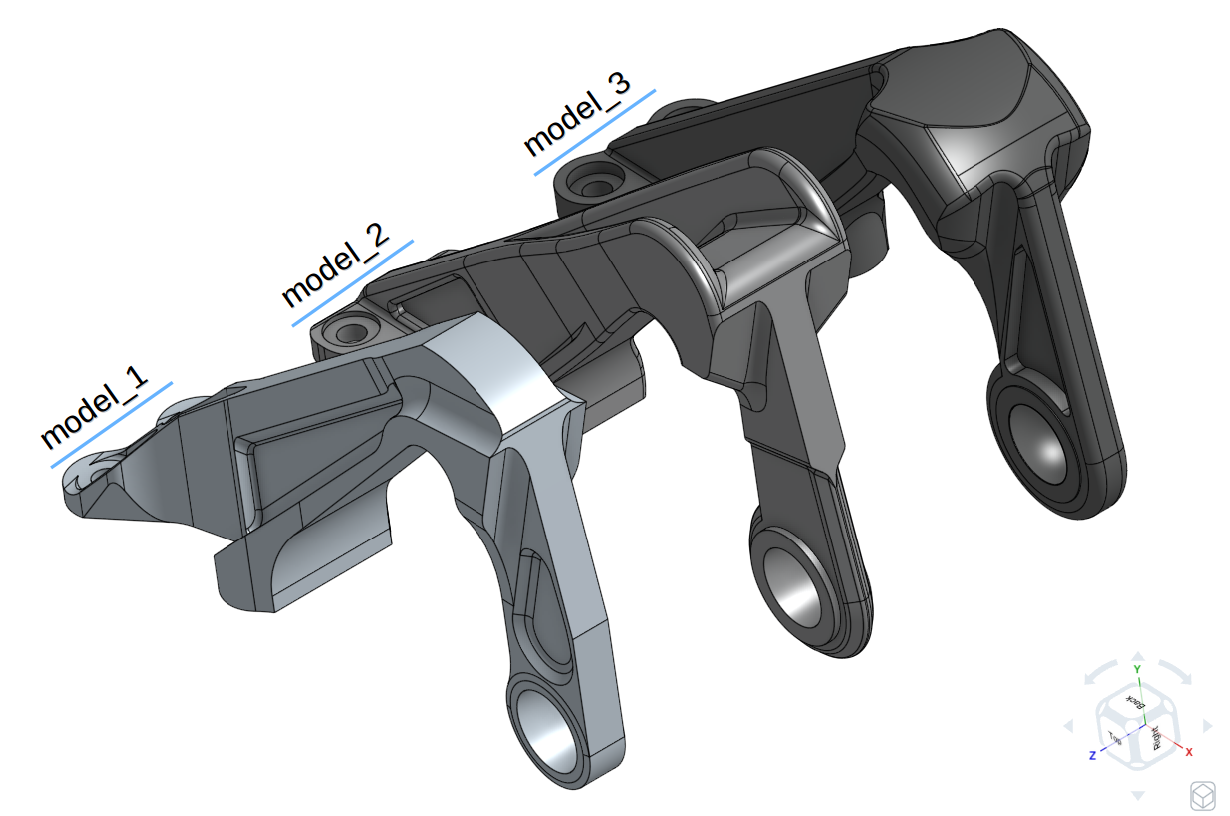
Image of the model or models which is/are analysed:
In our example we are using three different models for the analysis as shown in figure below:
Model Details
It is useful to reference a means of identification for future traceability such as;
- Number of nodes
- Number and type of elements
- DOF
- Type of Analysis: i.e. linear static or non linear static
Material Data
- Young’s Modulus
- Poisson’s Ratio
- Density
- Coefficient of thermal expansion
- Yield Strength
- Ultimate Tensile Strength
- Endurance Limit
Loads
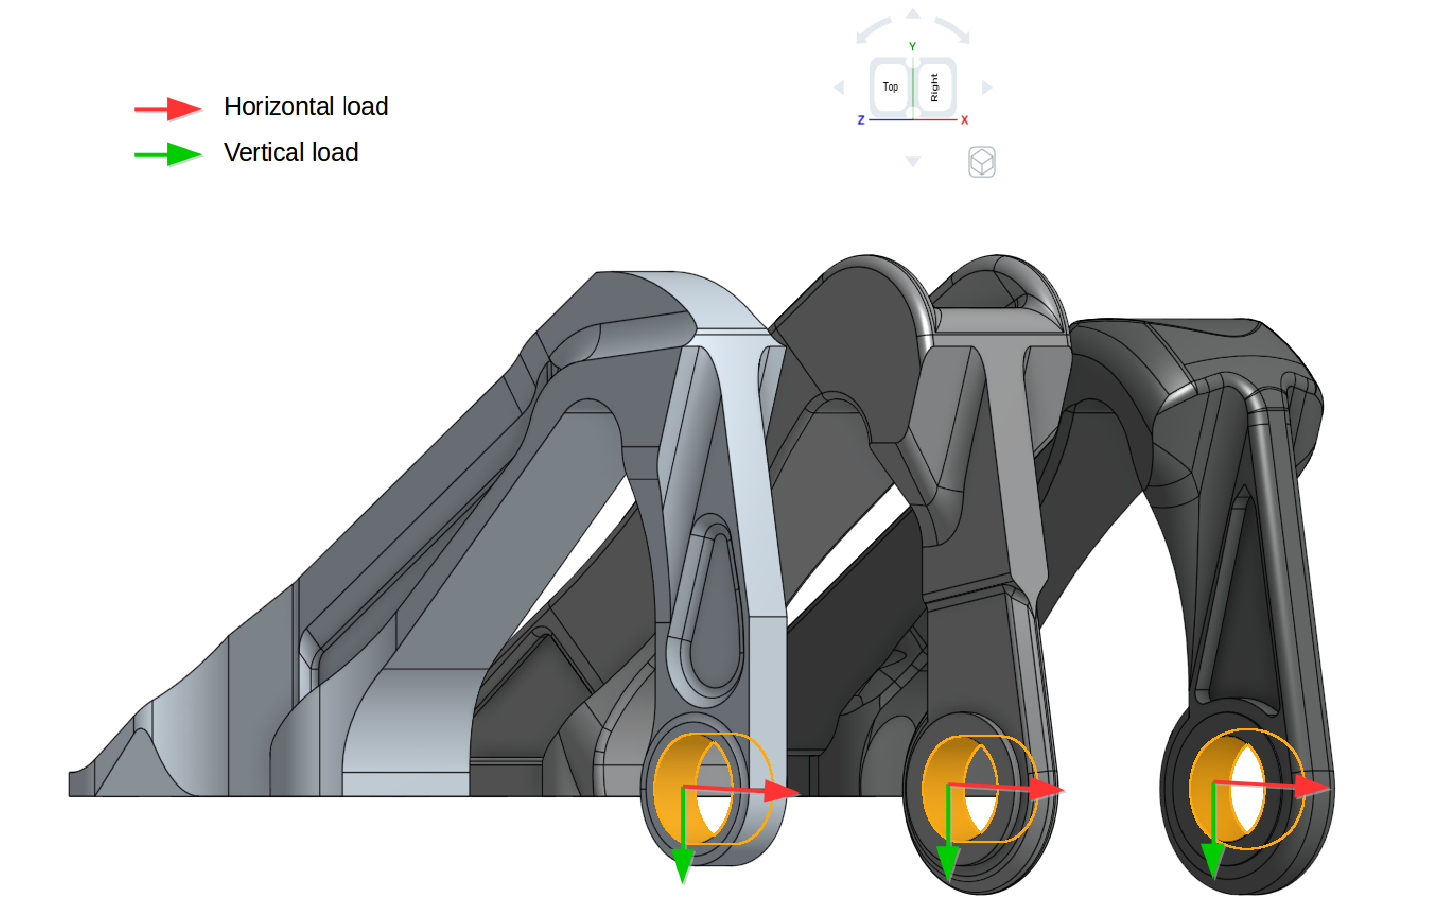
Show with illustrations where and how the load is applied such as force, pressure or heat source.
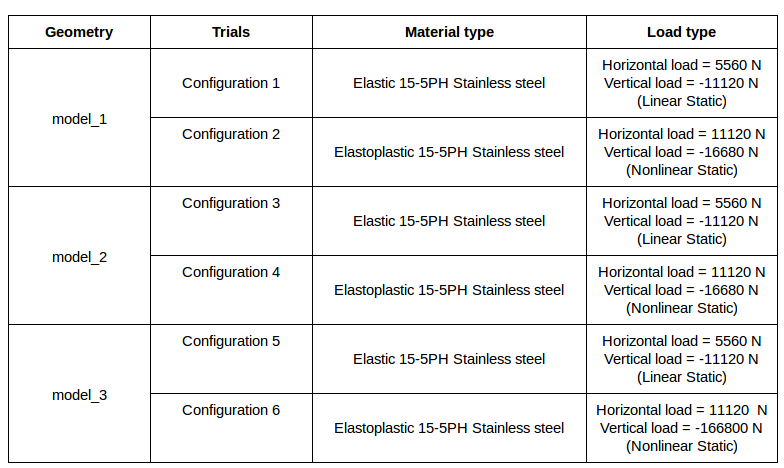
In the example, three models of the brackets are analysed with two different load cases each resulting in 6 configurations in total. One way to clearly show the different models and the loading conditions is as follows:
Constraints
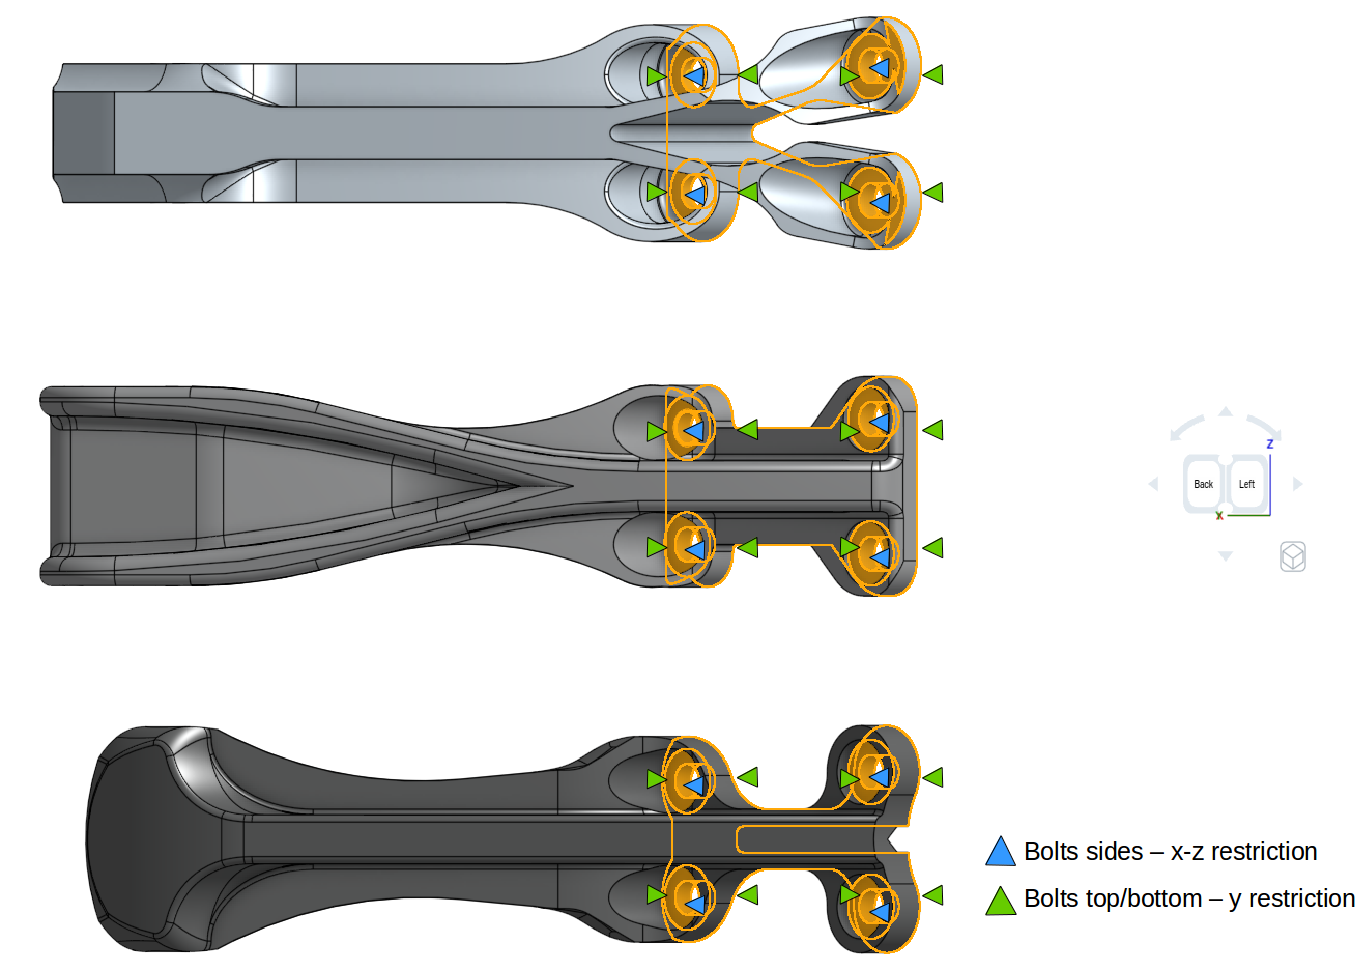
Show the locations of constraints and describe the degrees of freedom (DOF).
In our example this can be shown as:
Results
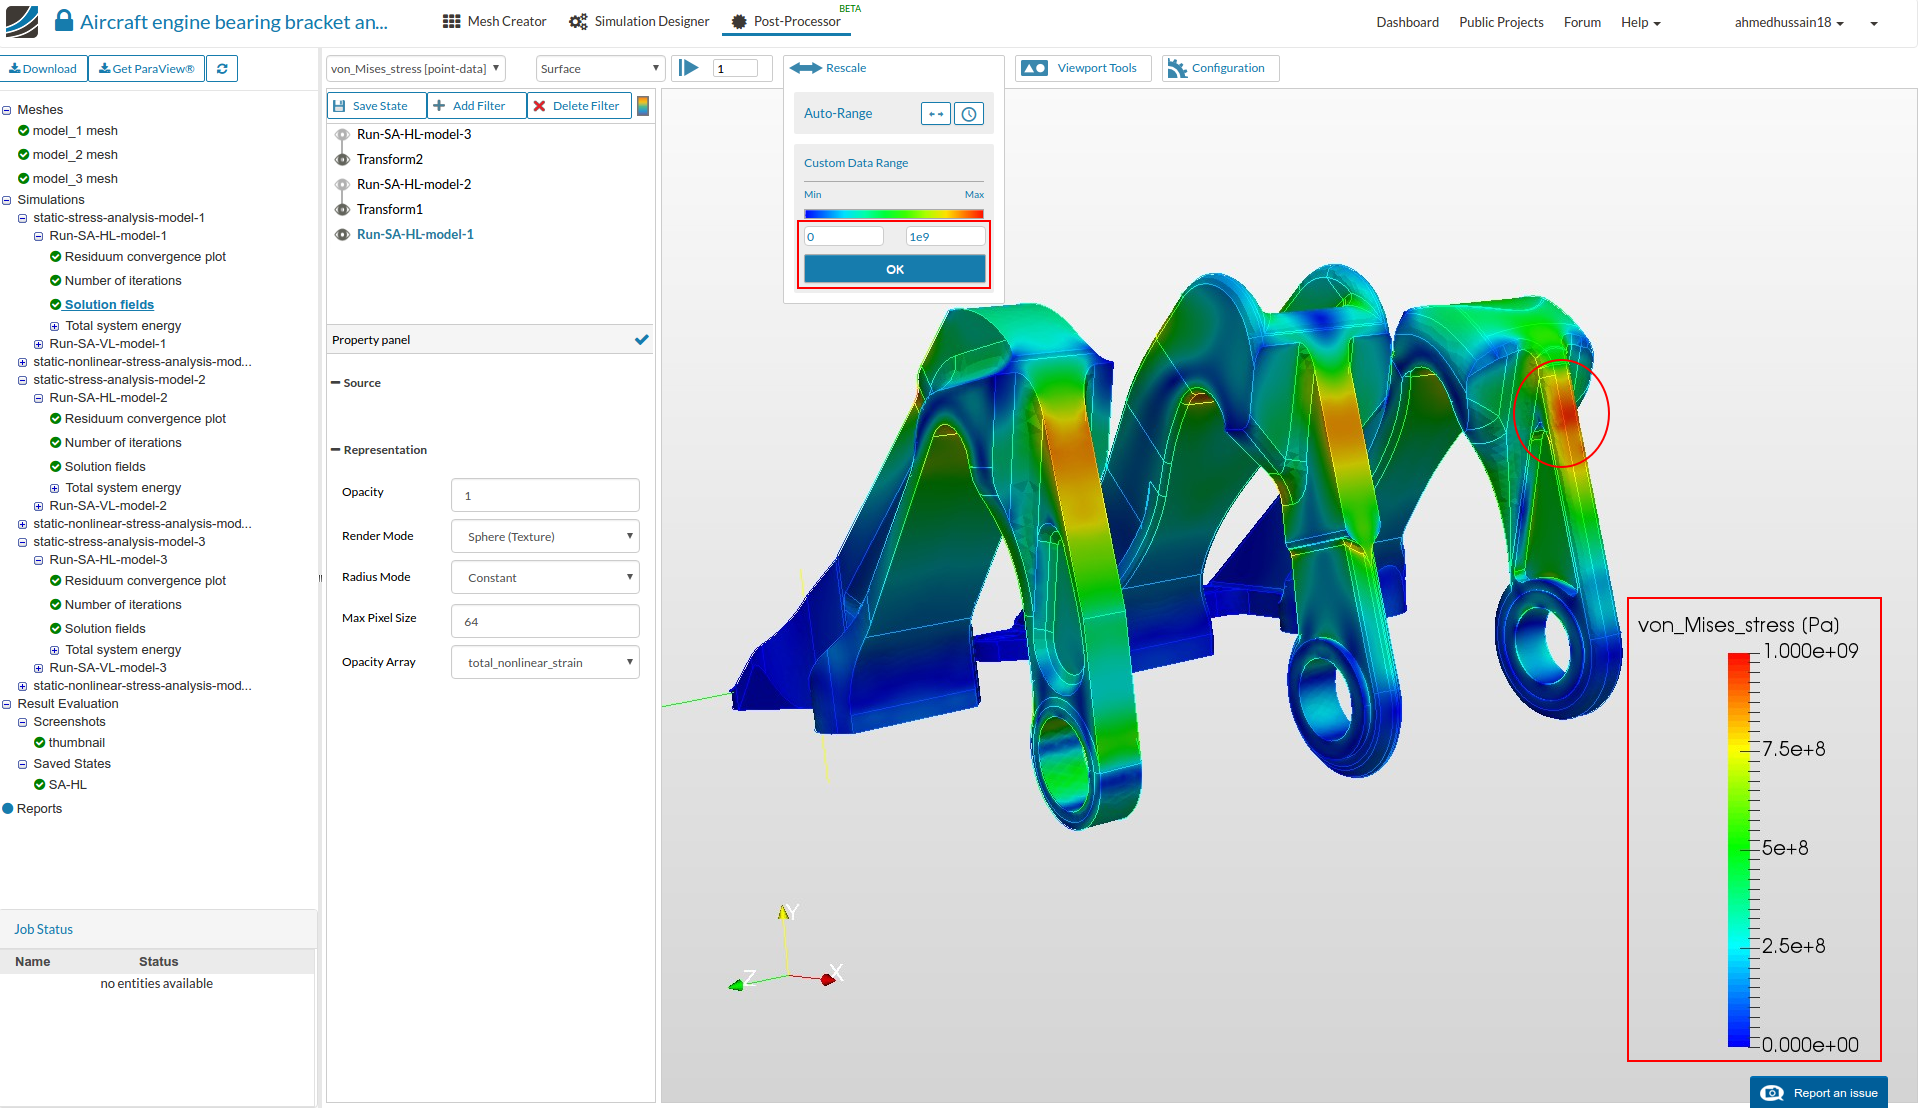
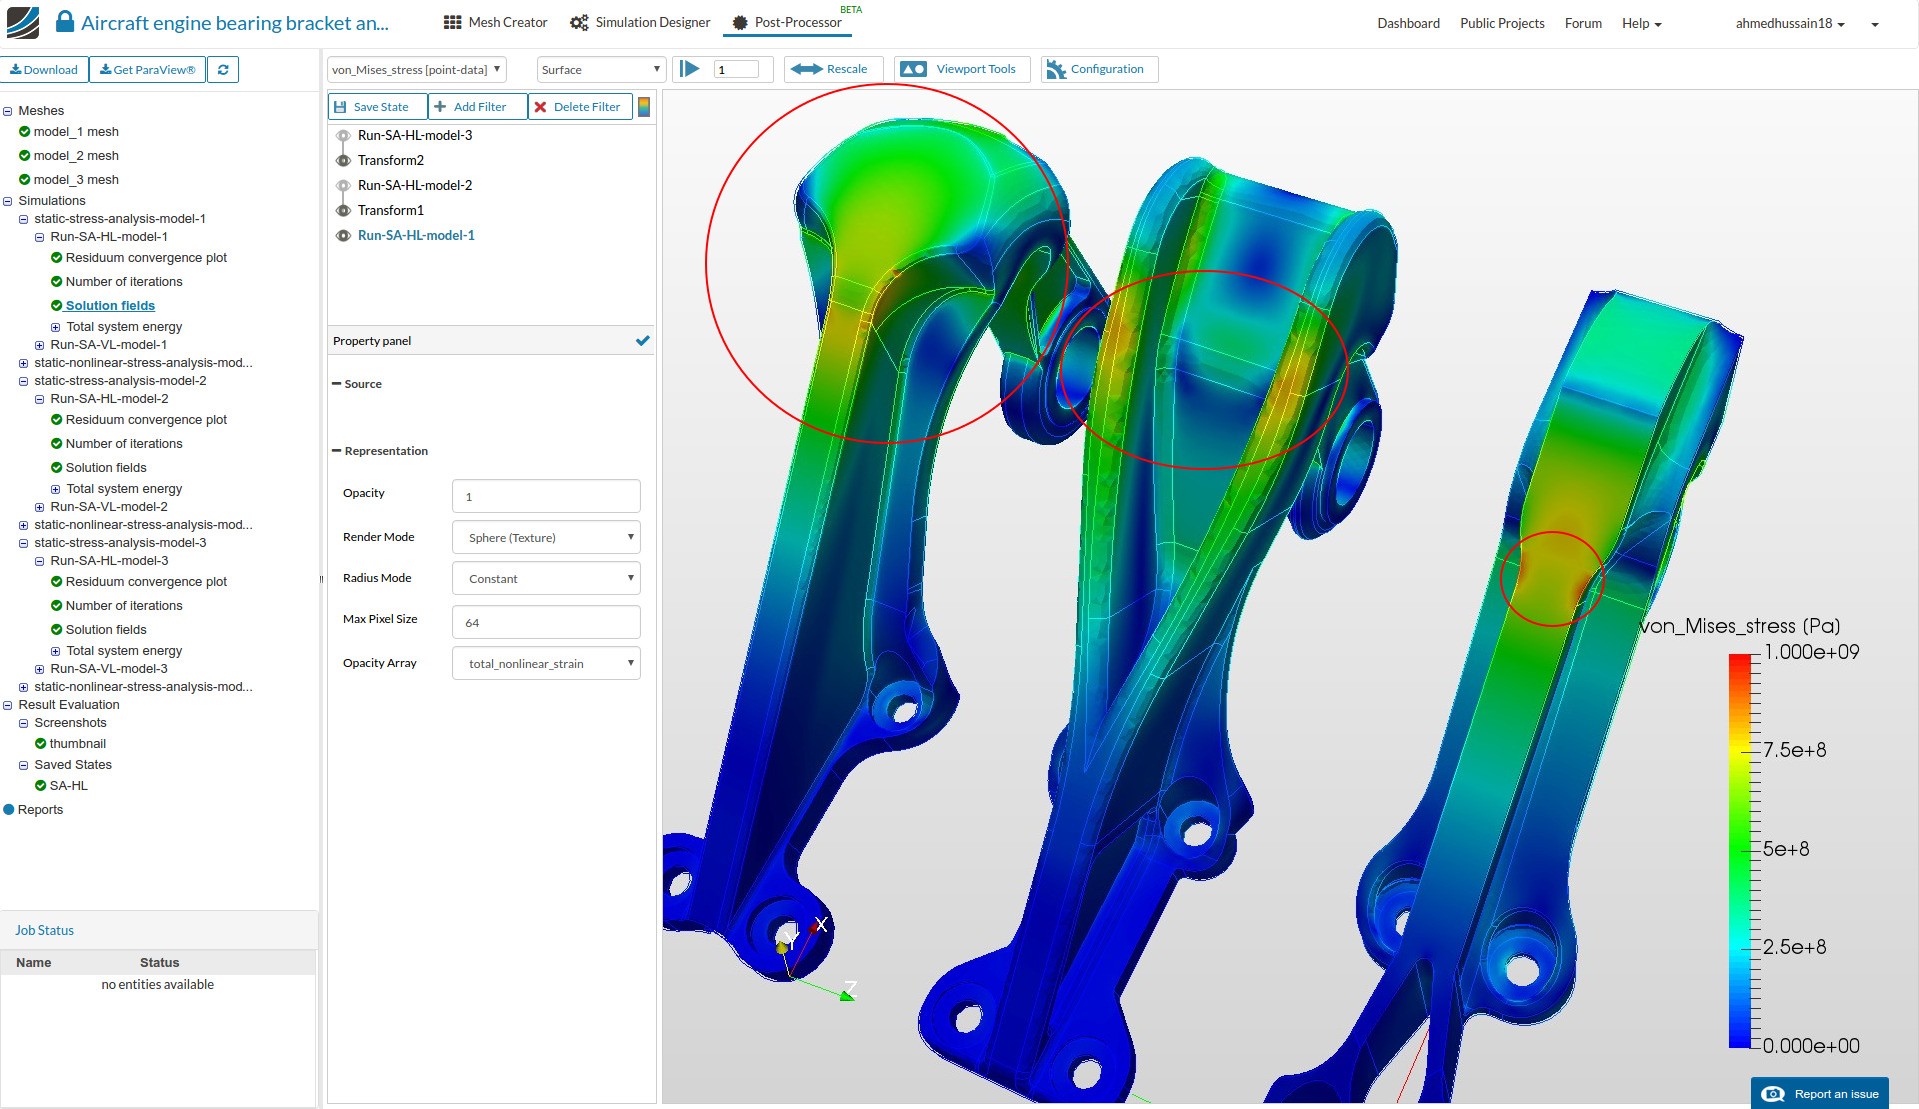
Include pictures of key stress (Vonmises or Cauchy stress) and displacement results, particularly highlight the areas where where you are getting very high vaues. It is useful to tabulate or graph results when reporting a high number of load cases.
It is also important to choose a proper scale when comparing stress results of different configuration or models,
The results obtained for different models in our examples are juxtaposed for proper comparison.
Conclusion
Report the key findings of the analysis and confirm if the objectives have been met. Recommendations for product improvement are always welcome.
References
List the references used for material data, loads and any hand calculation equations.