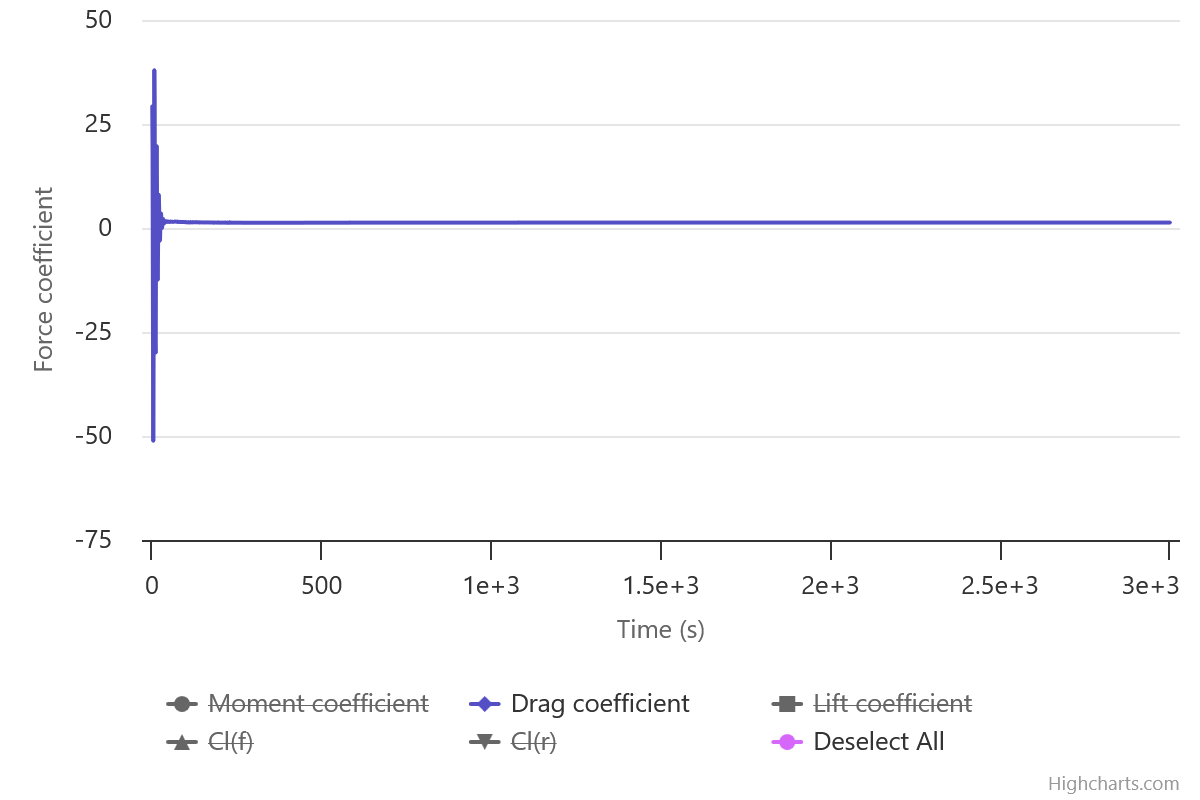
I just worked out how to do this. The data plots at the start of the simulation cover a broad range & are unstable so the scale can be adjusted by just selecting the area of the plot where the data is more is stable.
I just worked out how to do this. The data plots at the start of the simulation cover a broad range & are unstable so the scale can be adjusted by just selecting the area of the plot where the data is more is stable.