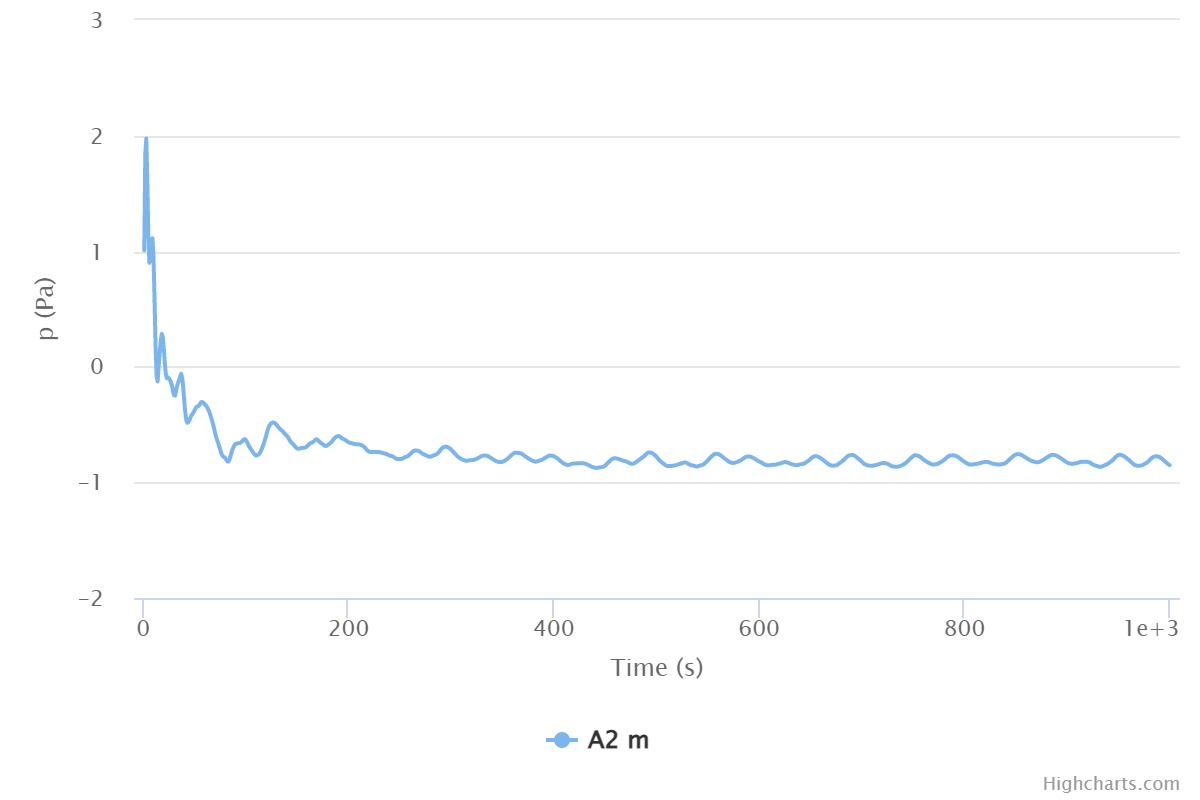
I’m doing a outdoor ventilation CFD simulation and testing the grid independence. I used a grid with fitness level of 6 with different regional refinement of max size of 3m, 2m, 1m and 0.5m. I selected the pressure of one point in my project, and the pressure graphs for the 4 schemes are illustrated below.
3m:
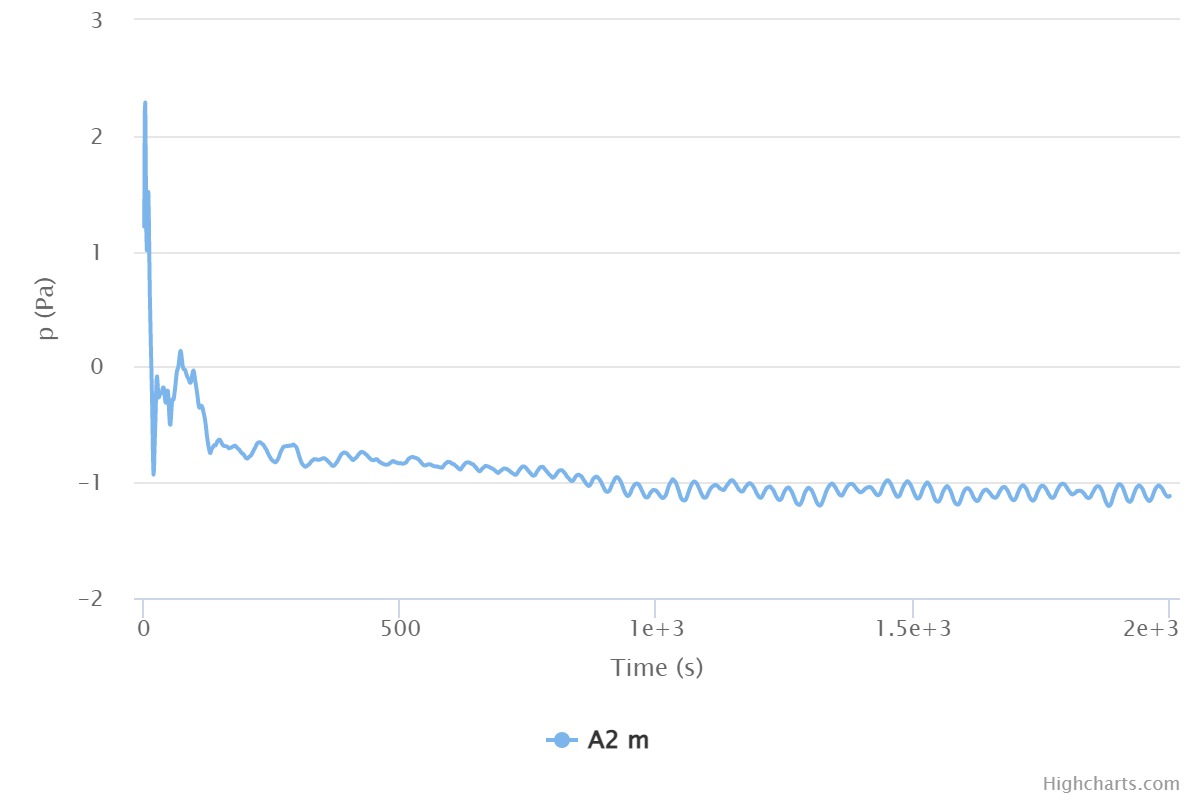
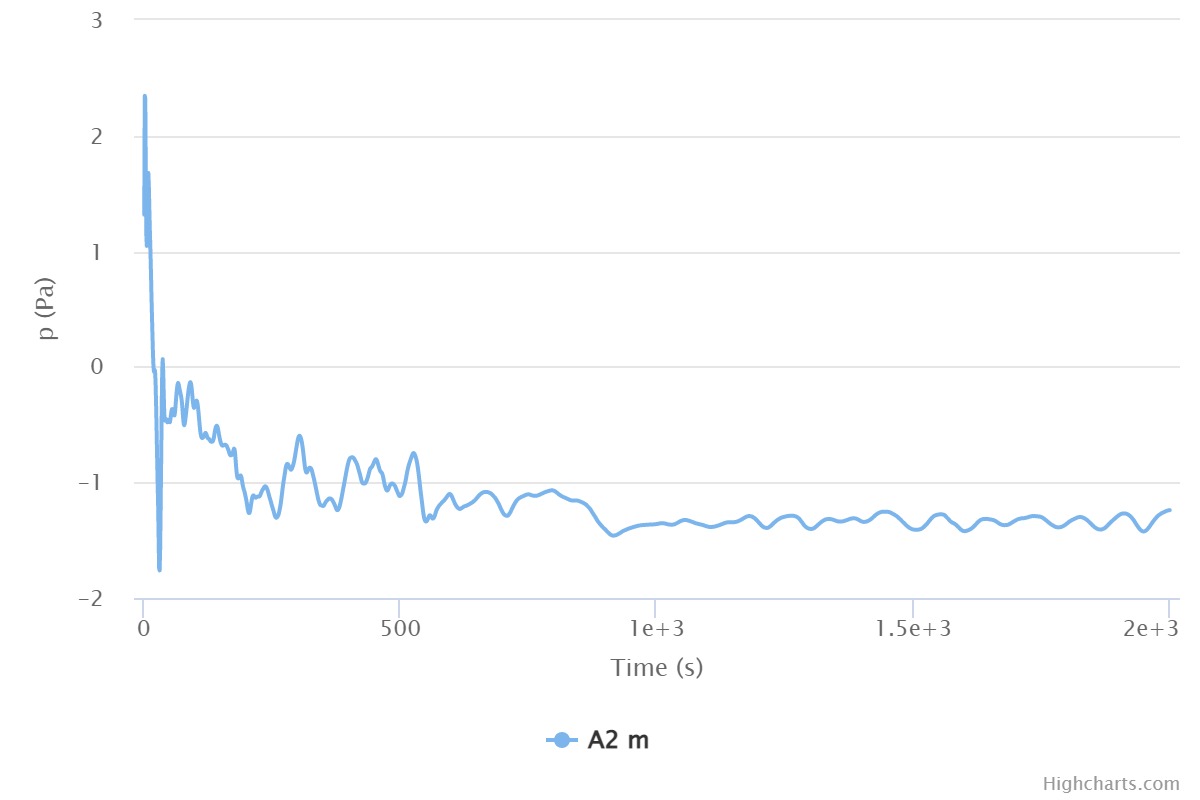
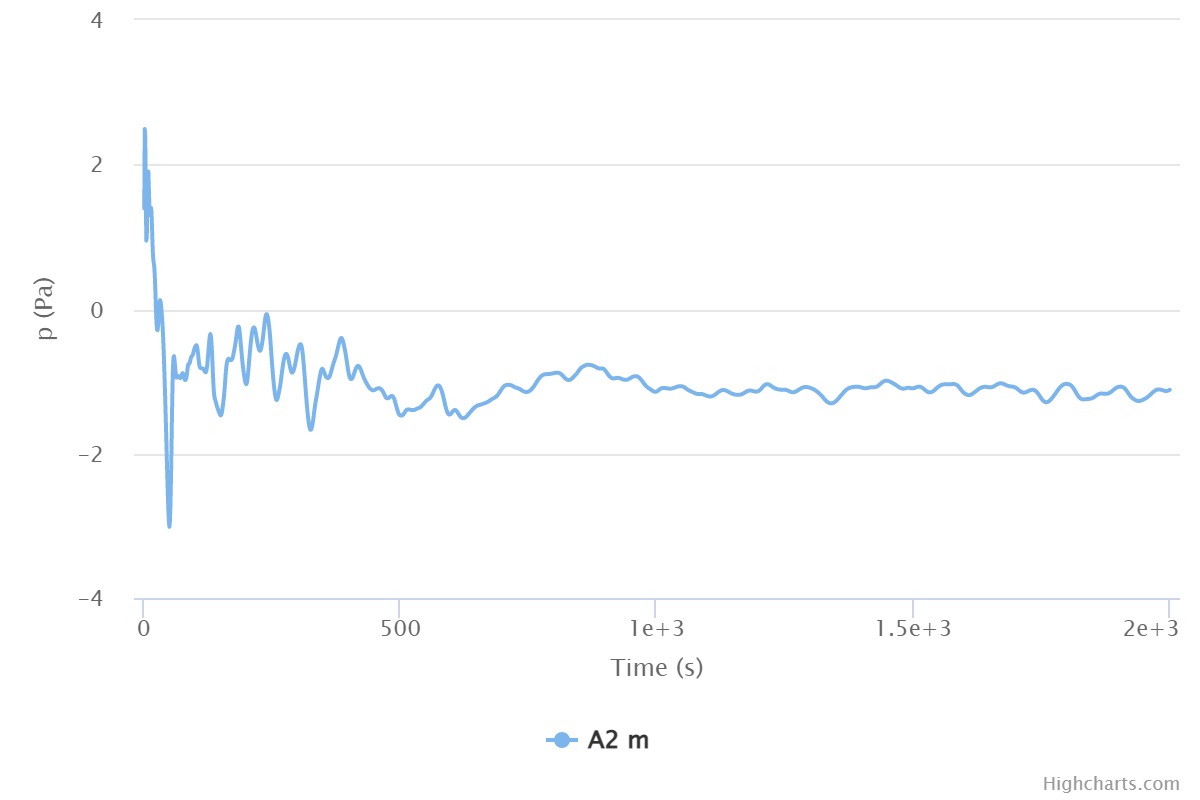
As you can see, the results for these 4 schemes are different. It is weird that the average result bounces up and down for the 4 schemes. If it hasn’t been converged, the result for different grid refinment will keep increasing or decreasing right? What is the reason for this? And I think 0.5m refinement is fine enough because I just use building blocks.
Can you please provide the URL to your project? I would like to have a look at your whole setup.
About the average that you are measuring, it can oscillate as you show due to some vortex shredding. Usually, the average of the last portion of this curve is taken as a representative value.
I can gain more insight after looking at the project.
[BDD Original VF - Copy | SimScale] Please have a look for the simulation ‘Mesh Check’. Also, you can see my residue for the simulation keep oscillating, and some results are higher than 10-3. Can I see the result converged? And what causes the oscillation. Thanks!