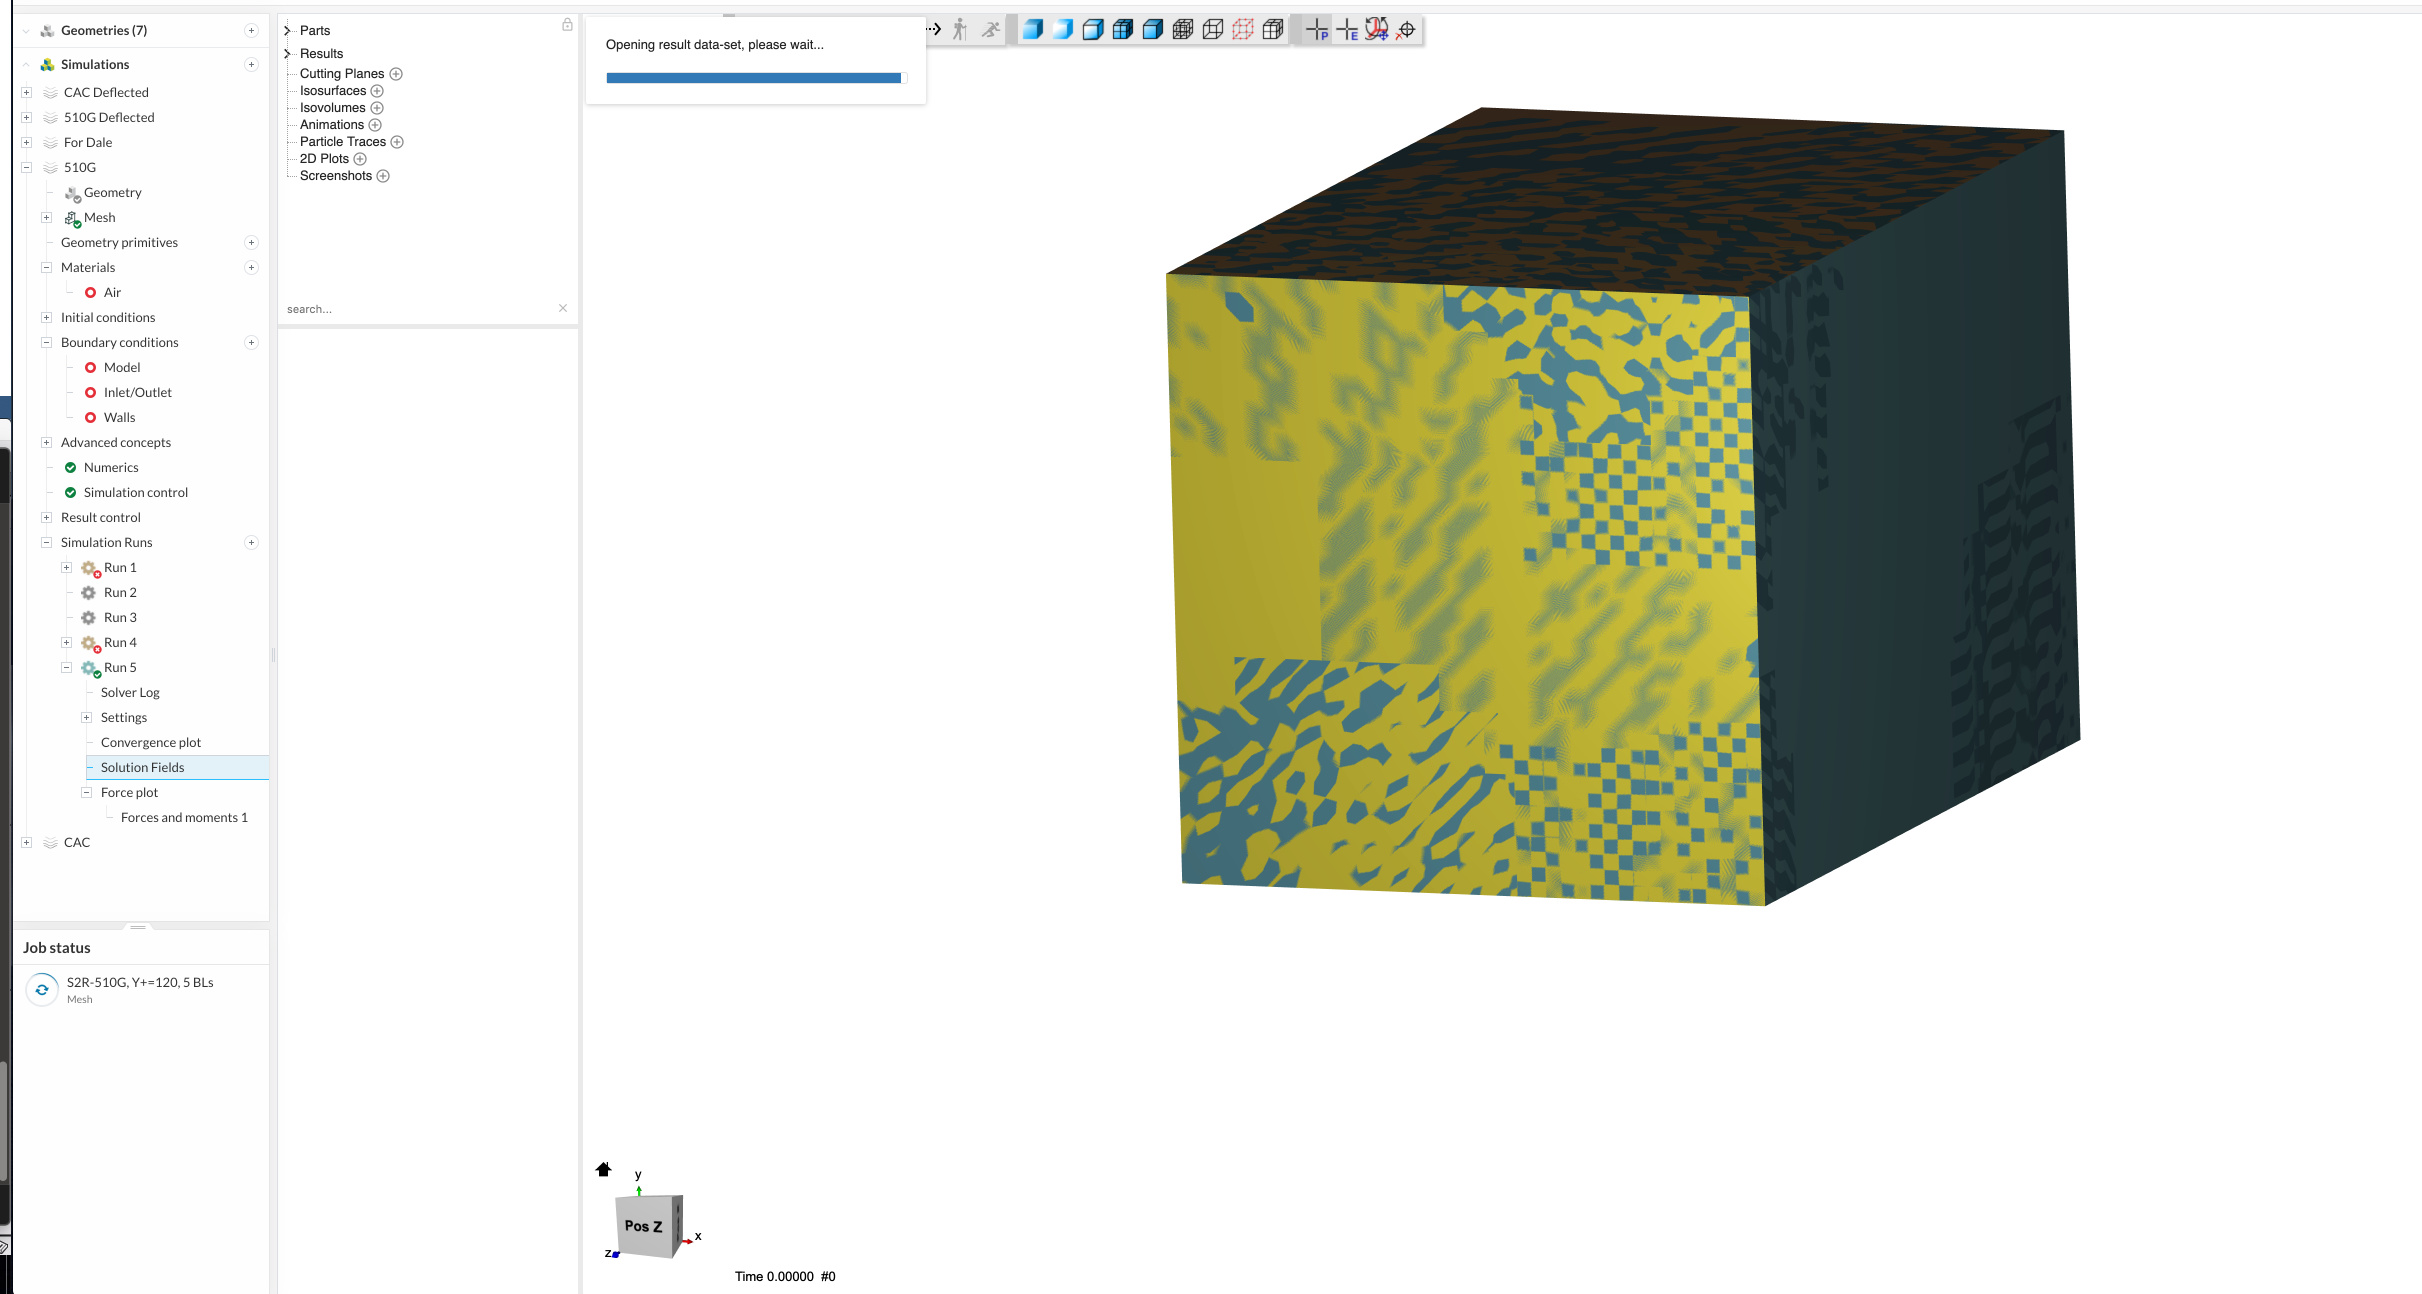
Could someone take a look at this run and tell me if you can get it to plot any results? The first time I post-process after the run completes (I’ve tried this with two different runs), I can’t plot any results but I can see the model with the appropriate timestamp. I also can’t change timestamps.
If I reload, it hangs on the loading progress bar:
I’ve tried:
Looking at known good results from other simulations - works fine
Clearing browser cache
Both Firefox and Chrome
Hi @jhartung
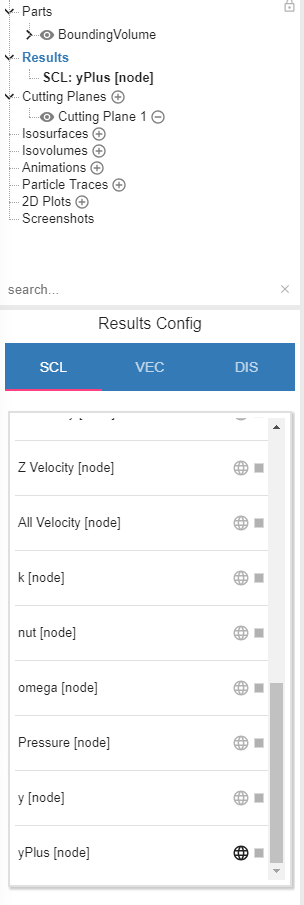
Just hide the yplus from the result section(by clicking on the globe like symbol  ) and the result will load.
Thanks
1 Like
Wow, great knowledge gained from that answer.
There should be a message when this is stuck!!!
@jhartung sorry this is all happening to you…
But I need yPlus!
@DaleKramer save your sympathy… I bring these things on myself 
I lost Y+ too, tried to change time step and was making headway until locked up again 
Oh, so maybe really is a glitch? You can’t get Y+ to plot either?
I’m working on mesh independence as the final touches for my yawing moment result coming out of this Thrush project. Need Y+ to show the result works/doesn’t work regardless of wall function or not.
side note I’m back to 99% BLs when I drop back to 5 to 7 layers. Oh I missed wall functions.
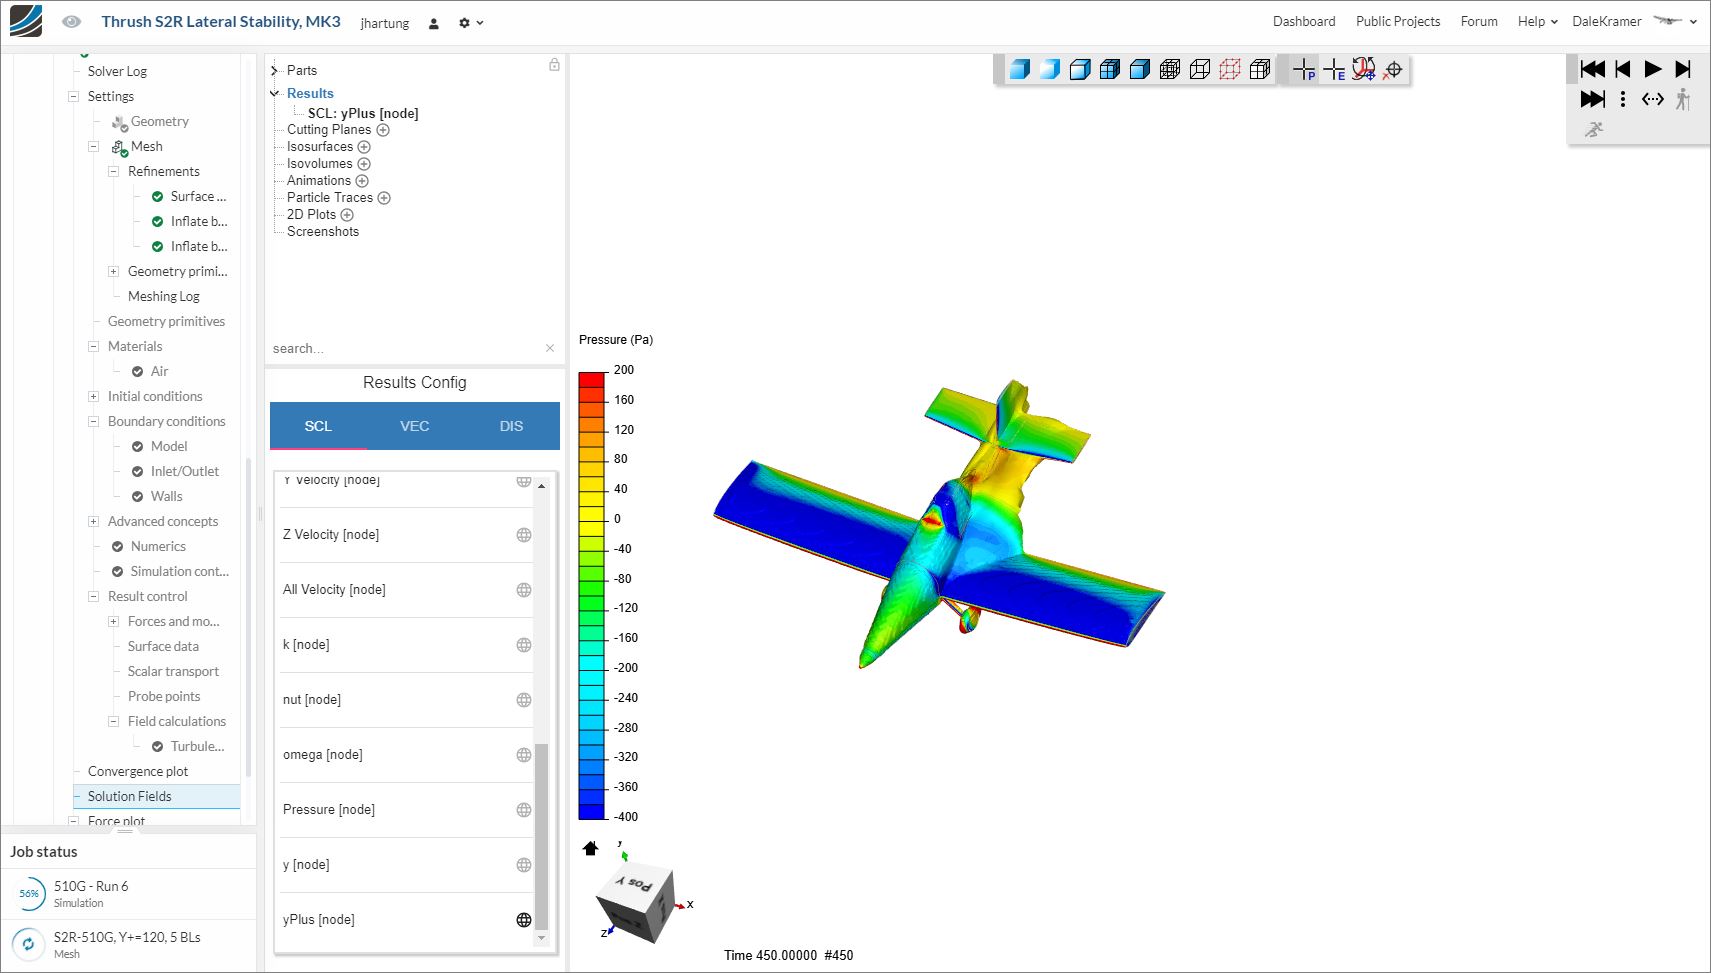
When stuck that time I closed browser tab, re-clicked on your link above and now Y+ and pressure appears in results and aircraft shows pressure and isovolume of pressure after this long (from my last post) …
Pretty weird but you should be going again 
Actually the problem is that when you have made your yplus contour(on entire plane surface) at one time and tries to open it at a later point of time, then it’s not able to render the colorful surface(i.e. yplus contour) and is consuming a lot of time. Thus removing the yplus will let your result to load easily. You can again toggle the yplus option once the results have loaded.
1 Like
But after I deleted the isovolume of pressure and was left with only Y+ result, I have not figured out how to display Y+ that is left…
This is fun. Maybe someday I can help you guys with your projects too.
I’ve got a calico airplane at time 450 and only yPlus enabled. Still not displaying but I’ll keep waiting.
Ha, I too am just waiting for Y+ to plot, but ZERO screen indication that anything is happening here 
The plane still shows isovolume pressure map and I only have Y+ in results…
Still waiting. I’m thinking @anirudh2821998 might be on to something. If I inspect a single element it lists step as Time 0.0000 when the time step indicator at the bottom left says 450.00000. Feels like a bug to me…
Yep, remember, couple posts ago I said it locked up trying to change time step…
Not sure how to get more help here right at the moment other than more
Well luckily I’ve got a feeling for Y+ on this particular experiment so I think I’m comfortable working from the force plots but I certainly don’t want to convert this to my very first Power Post until I can get those Y+ images… lest I look foolish.
1 Like
Hey Josh & Dale!
Good observation! It should not get stuck in the first place. The cause of this has already been identified we are now investigating!
Best,
Jousef
1 Like
YAY! Another win for the Mighty Morphin PowerUsers!
2 Likes
@jousefm sir, Is the issue regarding the plot viewer solved?? Andreas has been stuck in that problem for many days.
Thanks
Ani
Hi Ani!
Will take a bit (minimum 1 week) as this is also dependent on other factors. Please be patient
Best,
Jousef
3 Likes