Hi, I am using SimScale to achieve the CL and Cd for the NACA 0012 for different angles of attack in incompressible conditions with a K-omega SST turbulent condition, but when I check the data I achieve with data from Airfoil Tools or from the Abbott, I foud that the Cl is almost the same what is good, but the Cd start to change for a factor of 4. I had try to run simulations with slip and non-slip conditions for the profile but the cd that I achieve is still wrong.
So if anyone could tell me what that happening or what I am doing wrong, that would be very helpful.
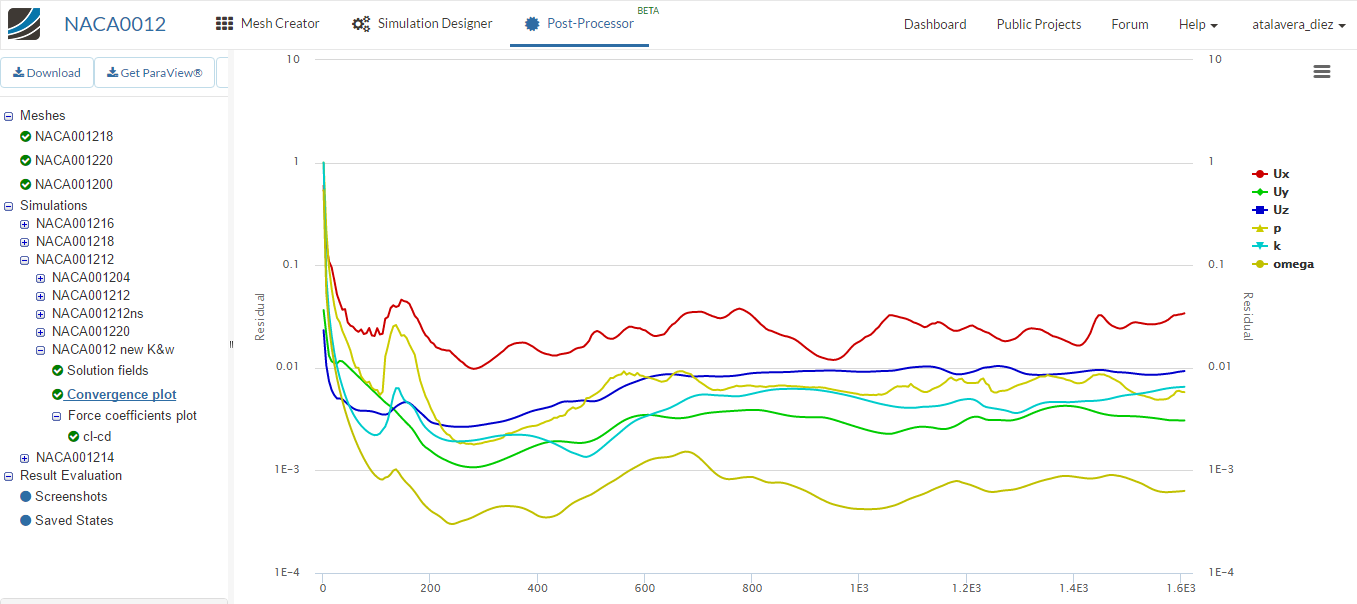
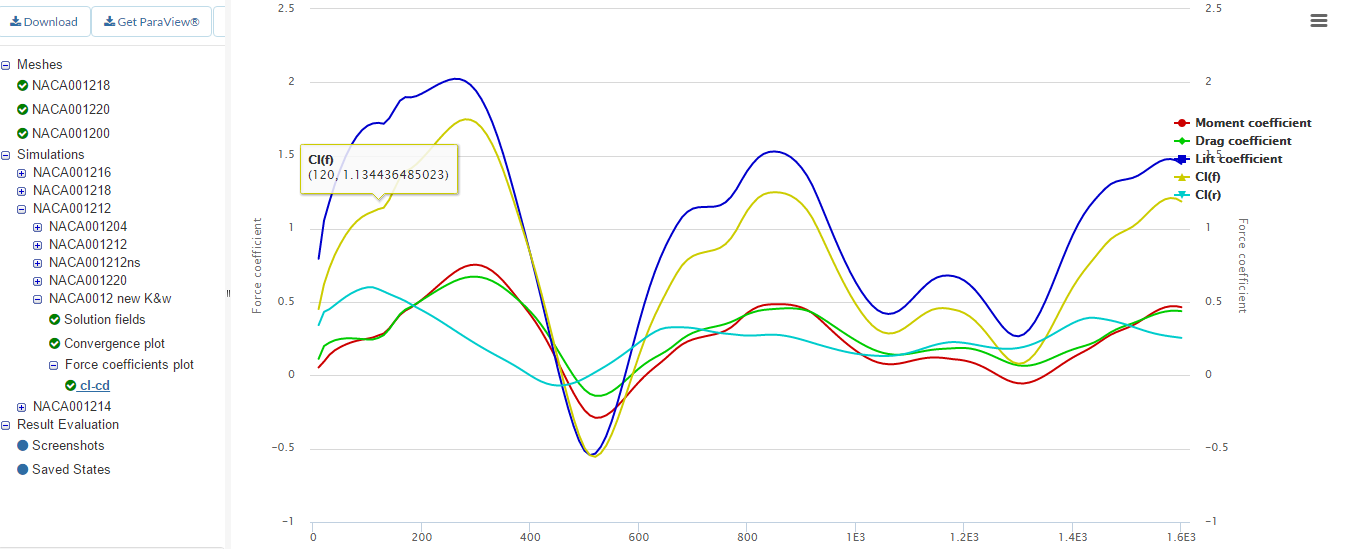
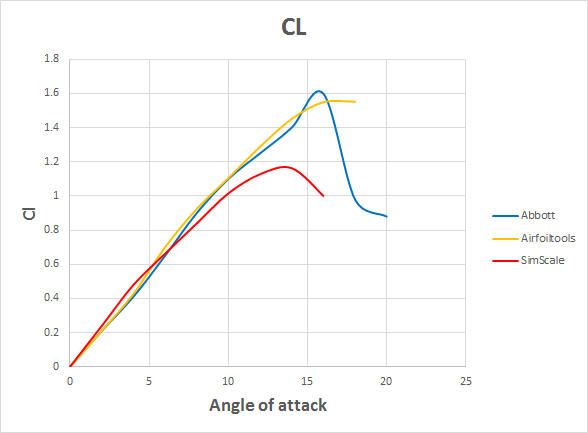
My project is named NACA 0012 and my name for the public projects atalavera_diez. I also add two graphics of the results that I achieve for the cd and cl comparing them with the data provided by airfoil tools and the Abbott. In the case of the Cd the line call /4 is the data achieved with SimScale divided by 4.
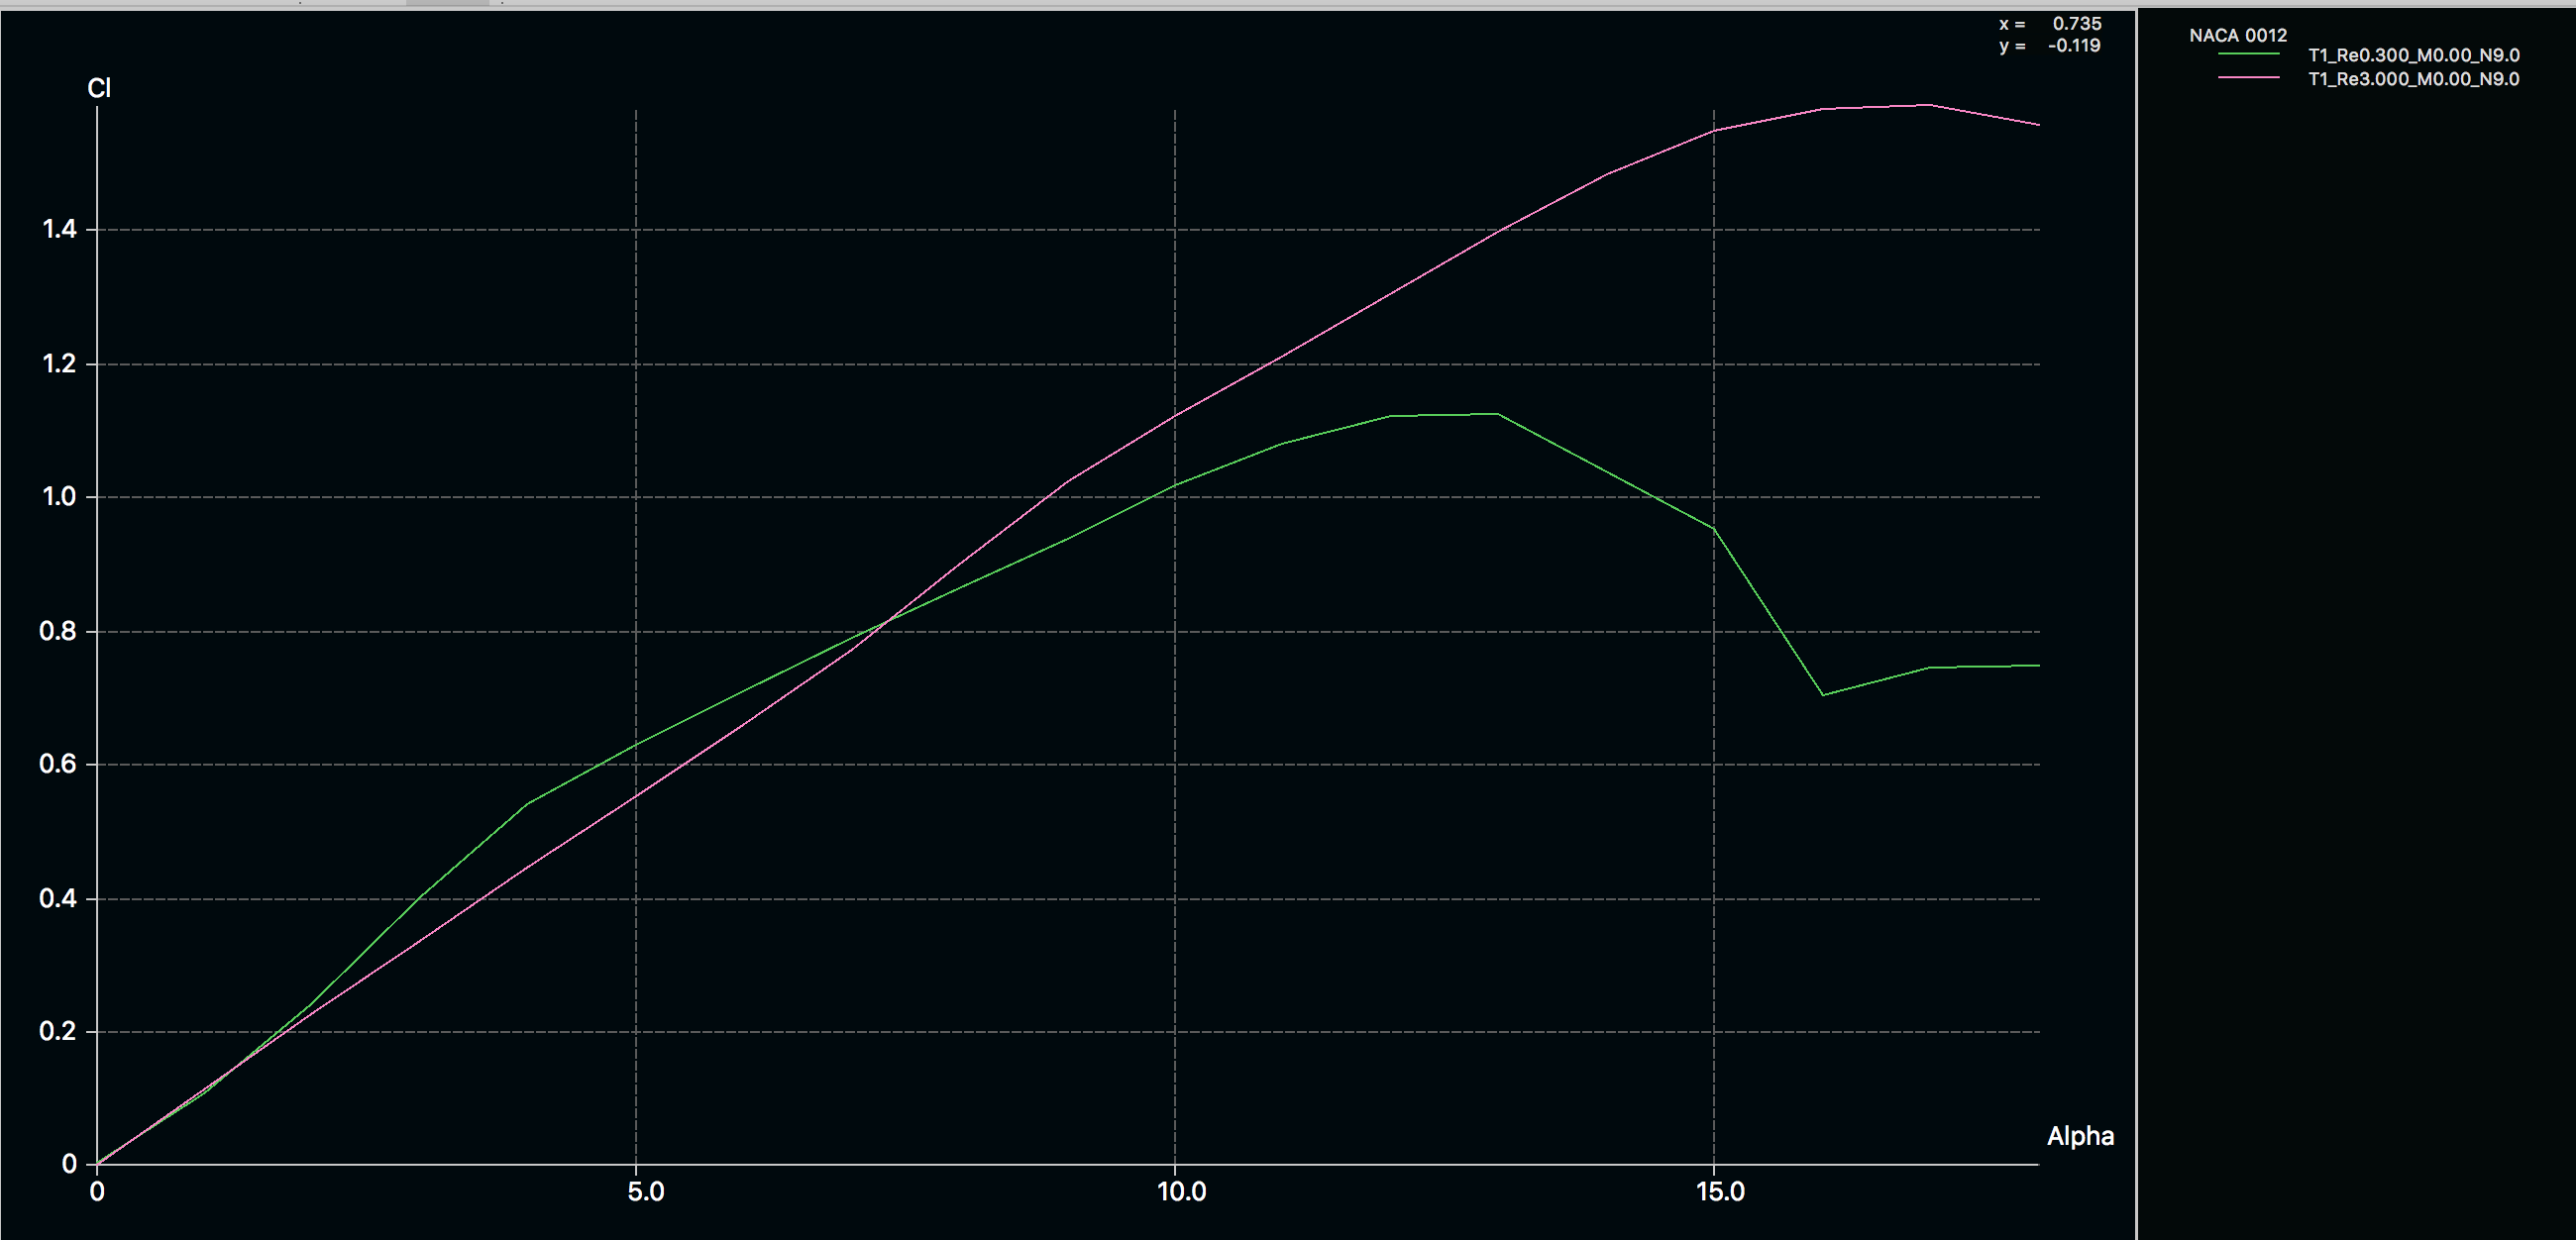
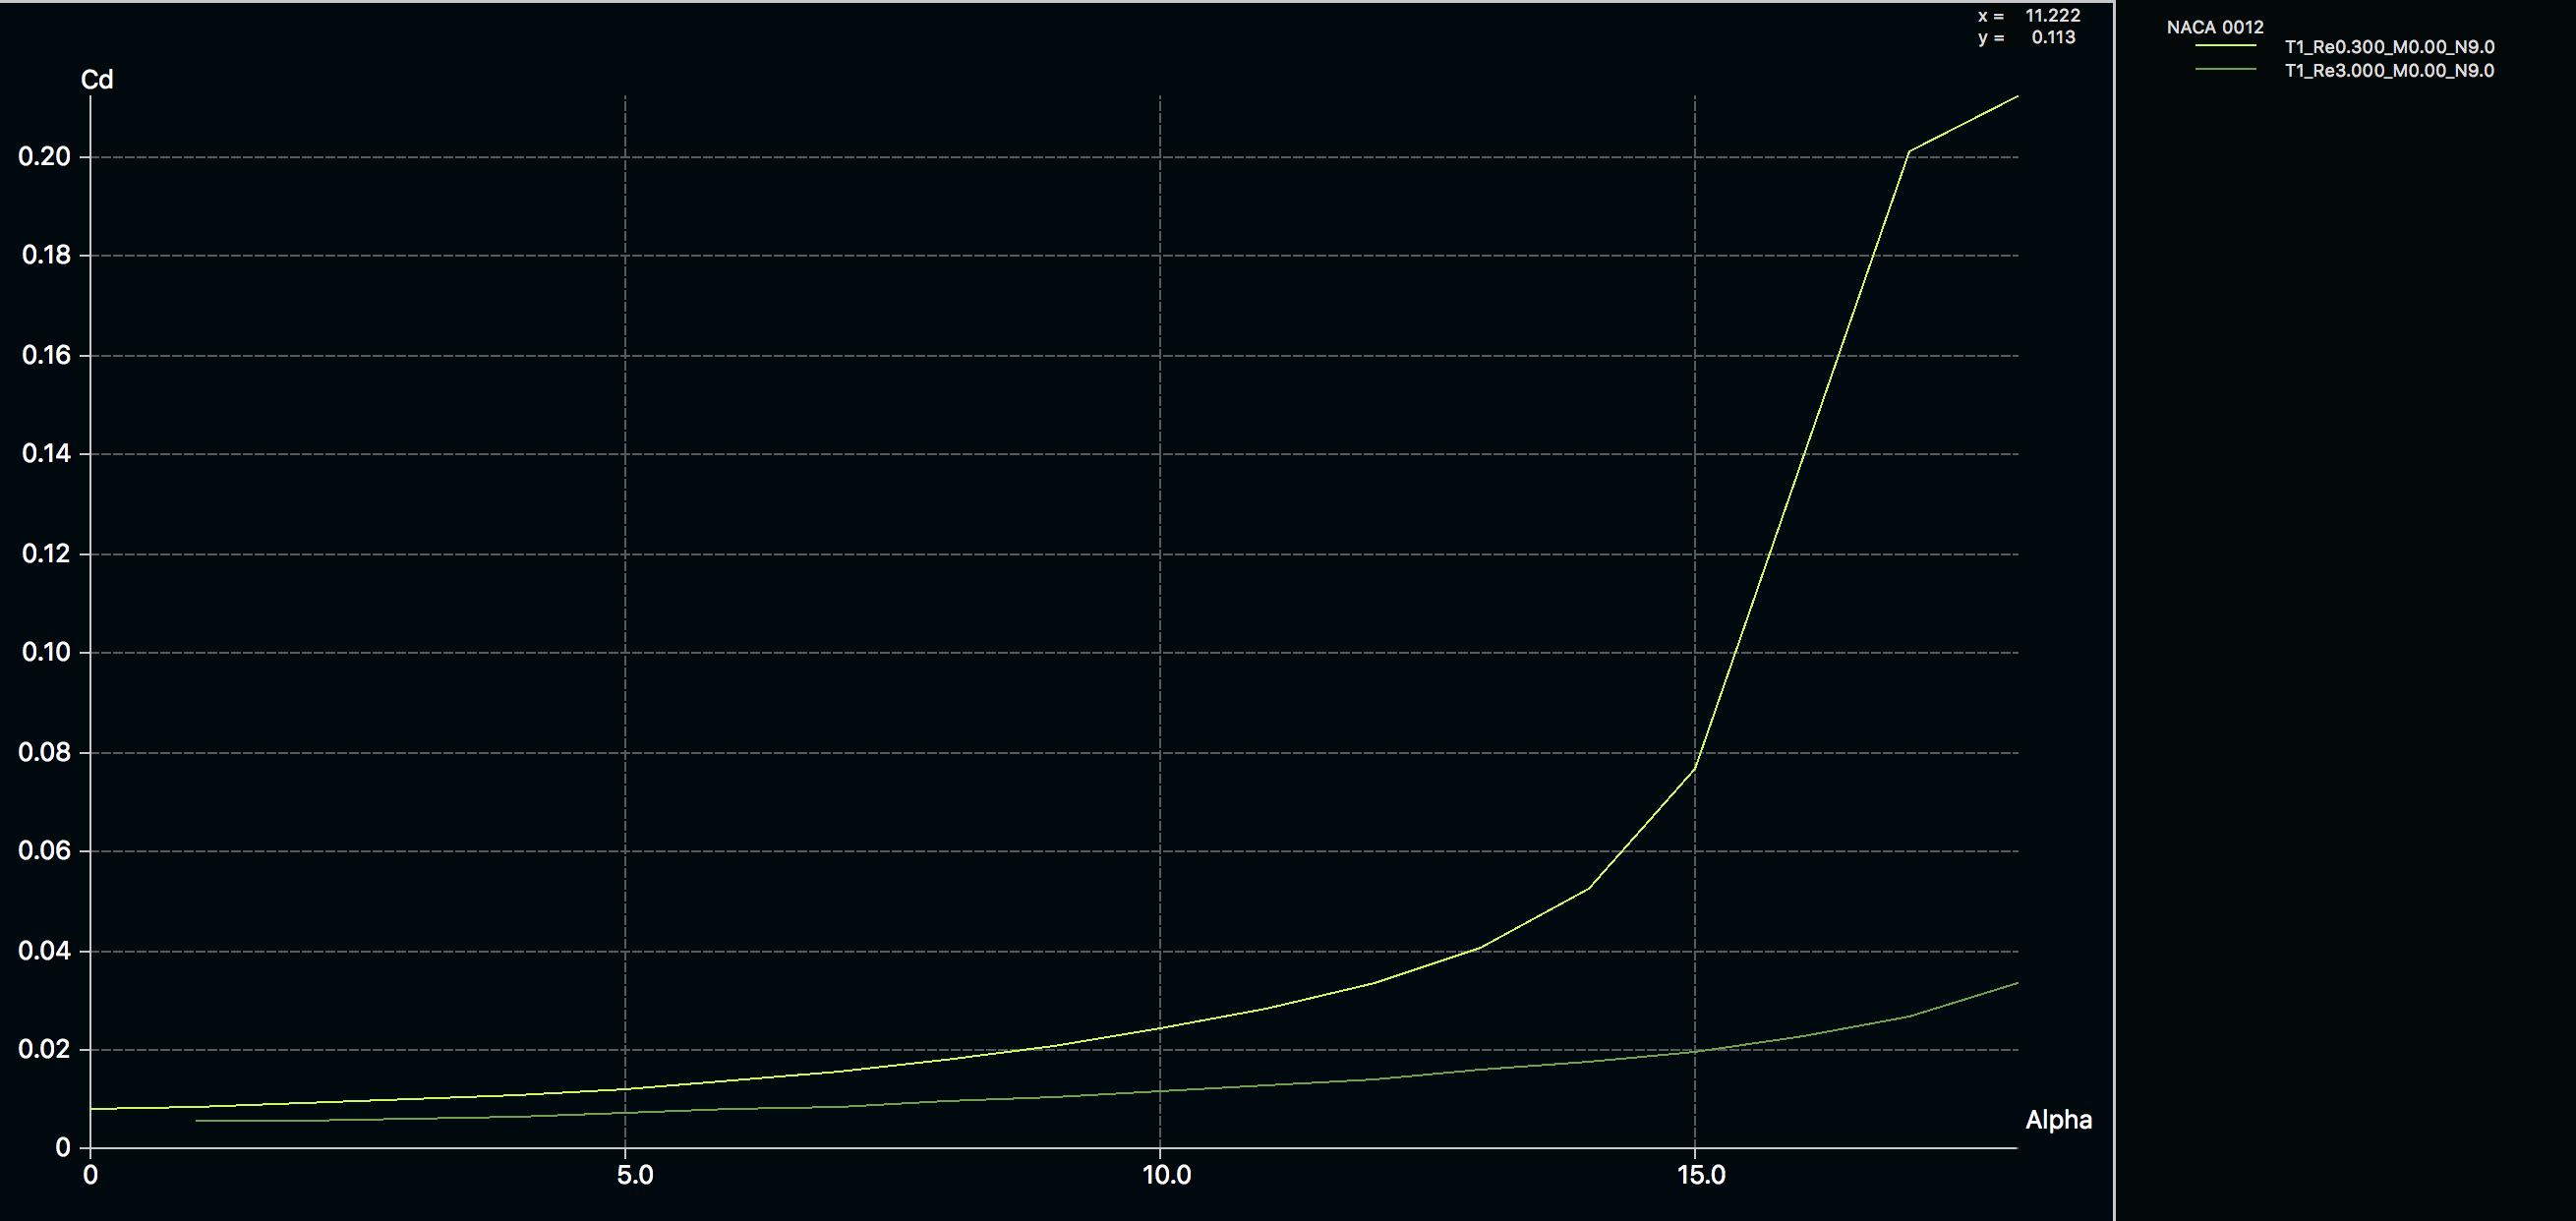
Hi, @atalavera_diez, it took some looking but I might have a potential solution. Firstly I thought that your setup is very well setup and was really unsure as to why you got this variation so I looked at the data from my copy of abbott and noticed that there are 3 sets of data, Re = 3e6, 6e6, and 9e6. When I typed your velocity and kinimatic viscosity in I got Re = 22.2*0.2/0.0000148 = 300,000 this is because you scaled your aerofoil by 0.1. So If this was the issue the difference would have looked like this:
Hi, @1318980, I am afraid that that is not the reason of the results, I check it again just in case, but the lenght of my profiles is 2 m, the reason I scaled my profile by 0.1 is that the original lenght was 20m so when I exported the geometry to stl format it didn’t lose accuracy in the geometry (cause in Catia the profile size was 20mm but when I export it to stl format it take the size in meters). Apart from that and form the fact that I don’t know jet which one is the problem I have, if the problem was the Re shouldn’t be also the Cl different from the Abbott data? Because what confuses me the most is the fact that the cl is almos perfect but not the cd.
Also I had the same problem with the profile NACA 0018 and when I run these simulations I thought that the problem could be that my Re is 3e3 and the higher Re of airfoil tools is 1e6, so I run simulations with the NACA 0012 to compare the results with the data form the abbott but I found the same result.
An I forget to mention, in the first post, in the plots I attach in the first post the Re from the data of the Abbott is 3e6 and 1e6 for airfoil tools.
@atalavera_diez, a head scratcher. Ok, I see what you mean by the scaling now. As for the Cl value, I think there is too much error. Looking at the Cl plot I posted above, I see more similarities with the 3e5 graph and simscale. The way it peeks just before 1.2, earlier and the 3e6 (more consistent with abbot or aerofoil tools) peeking just before 1.6 Cl. See what I mean?
So I want it to be the Re number but I can’t see how it could be. How did you calculate the turbulent inlet values k and omega?
The simulation get cancelled at 80.45% because of the time (I give for the end time value 2000 seconds). Should I try again increasing the time or it didn’t worth it? I really don’t know which could be the mistake cause in all the forums and works that I have look into they said that the SST turbulent model should be enough for my kind of simulation.
Hi @atalavera_diez, no not worth increasing time… I’ll do a few runs and see what results I get.
Can you just explain the numbering system in your runs what does the 2 digits after naca0012 represent, initially I thought it was AoA but then there were different numbers for runs and simulations and it looks very confusing.
Interesting discussion. Lets hope we can get to the bottom of this.
For turbulent flow, the forces on a body are quite sensitive to the behaviour of the fluid near the surface - thus, an important feature of turbulence models is near-wall treatment, i.e. how do you model the flow near the wall? Broadly, for RANS, there are two approaches: full resolution and wall functions.
Full resolution means, that you model the flow near the wall until you reach the region where the wall-normal flow gradient is linear. i.e. \frac{du}{dy}=c. In such cases, the non-dimensional near-wall distance y+ should be kept under 1, so that the first cell in our mesh near the wall lies within the linear region.
The use of wall functions means that we estimate the near-wall flow with some model for the near-wall behavior. In this case, y+ should be between 30 and 300.
This link is a useful tool to compute the thickness of the layer closest to the wall.
In the case here, on examination of the simulation setup, we see that wall functions are being used at the walls. This means that the y+ value should be between 30 and 300, which corresponds to a first-cell thickness of 0.00051 m to 0.0051 m. But in the mesh used here, the first-cell-thickness is 0.01 m. This could explain the discrepancy in the results.
The next approach would be to create a mesh that conforms to this first-cell-thickness using inflation layers.
Hi @1318980, yes the number system represent the AoA, what I did was create four meshes and four simulation design and later so I didn’t have to create the mesh again and write the parameters again I just change the geometry in the previous meshes that I created and run again the simulation design.
In the post-processor if u open each one of the simulation you will found also some simulation with “ns” write before those are the simulations that i run again changing the wall conditions to non slip and the rest that have something behind the numbers where just tests.
Hi @sjoshi, I start using CFD programmes this year and so SimScale so I don’t fully understand everything.
When you create the mesh you need to create a region of cells where the cells had a thickness of 0.01? It isn’t enough the uso of the inflate boundary layer? Cause when I created the mesh, I checked the wall spacing I should have and therefore for the thickness of the final layer in the inflate boundary layer I give it 0.001 but because it doesn’t have dimension I am not sure if that is correct or not.
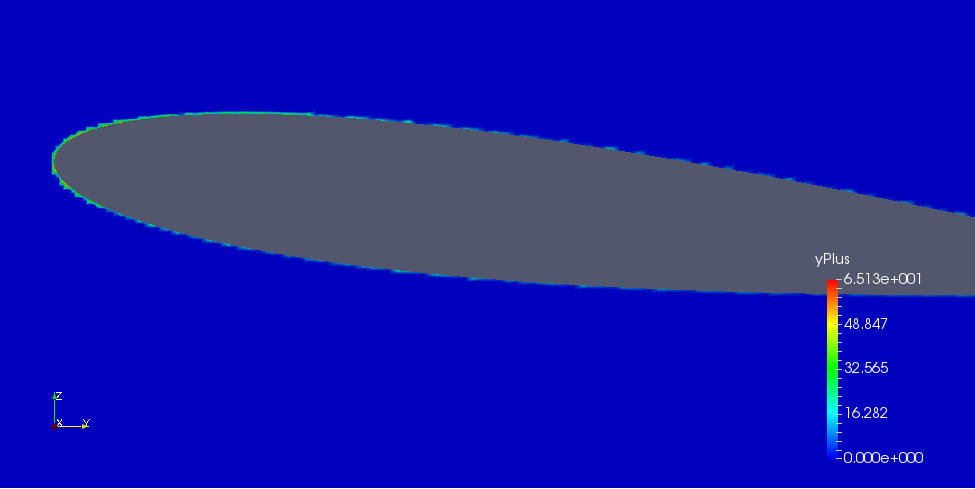
Also I attache a screenshot of the y+ in paraview of the NACA 0012 at 6 AoA where it says that the y+ maintained approximately between 48 and 16
If you have left the mesh as default layer setting then the value is relative (and that explains why yours didn’t inflate?) so for example, a final layer thickness of 0.3 will give a thickness of 0.3 of the thickness of the cell at the inflation surface.
This can be changed to be actual values, however depending on the mesh refinement level occasionally the layer will have trouble inflating.
When you create the mesh you need to create a region of cells where the cells had a thickness of 0.01? It isn’t enough the uso of the inflate boundary layer? Cause when I created the mesh, I checked the wall spacing I should have and therefore for the thickness of the final layer in the inflate boundary layer I give it 0.001 but because it doesn’t have dimension I am not sure if that is correct or not.
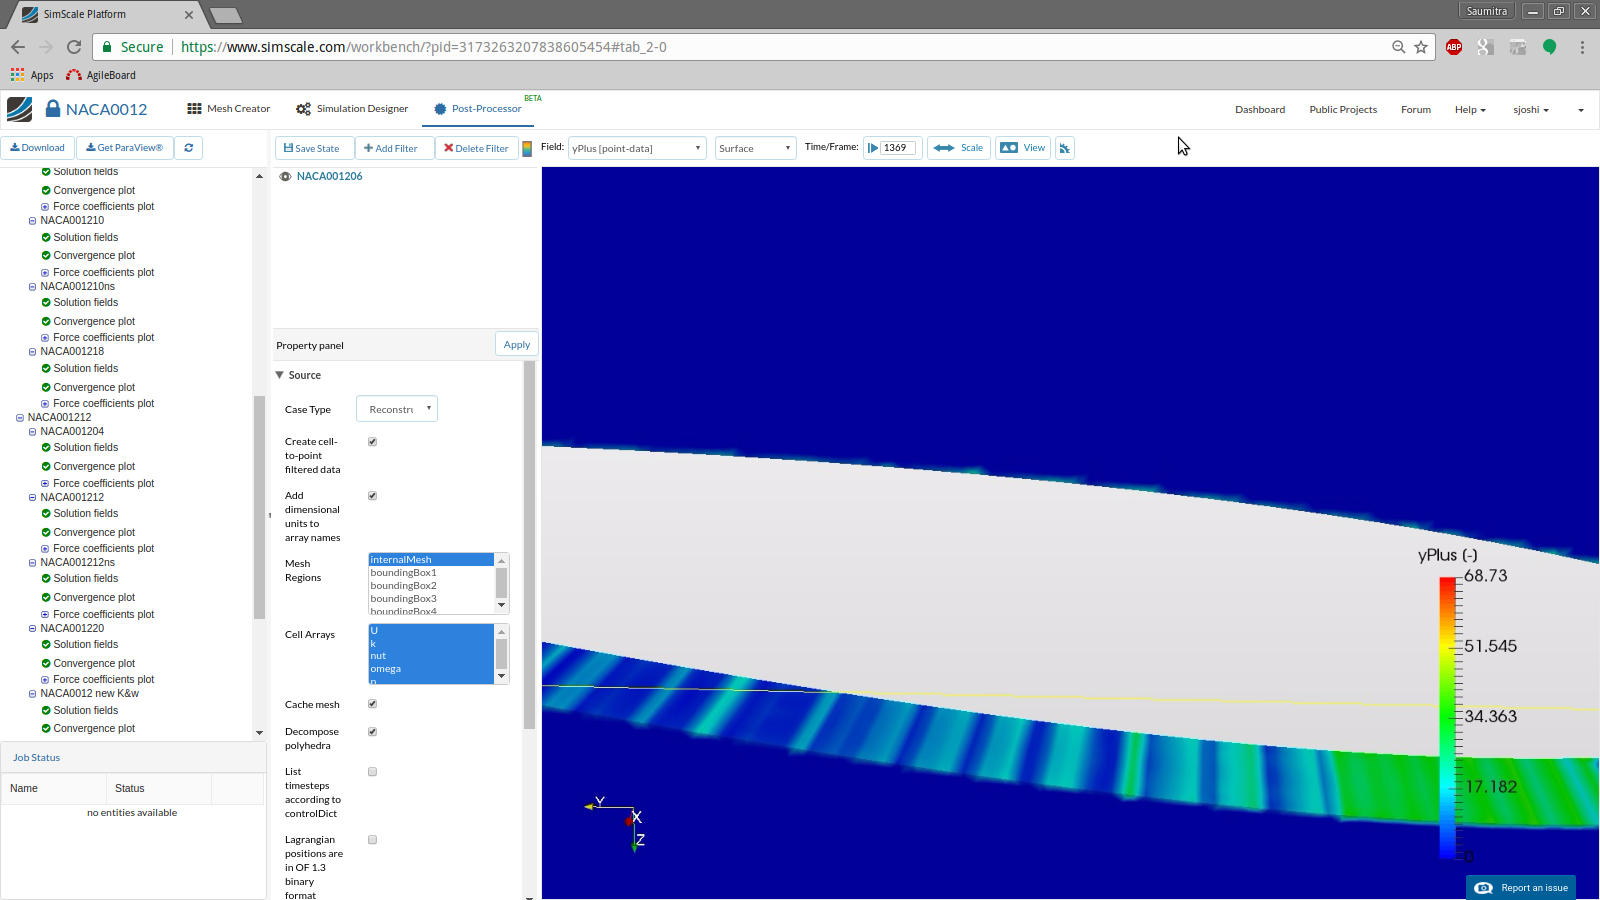
I investigated in greater detail the y+ values for the mesh you mentioned - it seems that in quite a few regions of the mesh, the y+ is under 30 (see image)
You are right, inflation is the right solution. It seems that the layer addition for your mesh did not work. This happened for a few reasons:
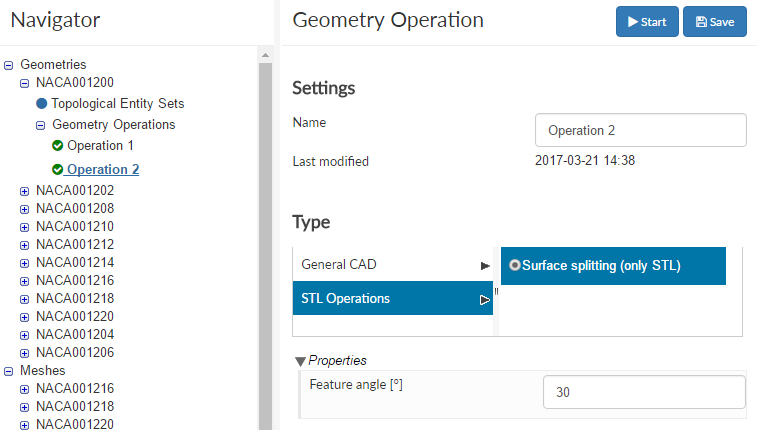
The STL geometry that you used in the mesh defines the entire surface as 1 face. The meshing algorithm requires that the faces be split. The first step would be to split the geometry using the “Split” operation.
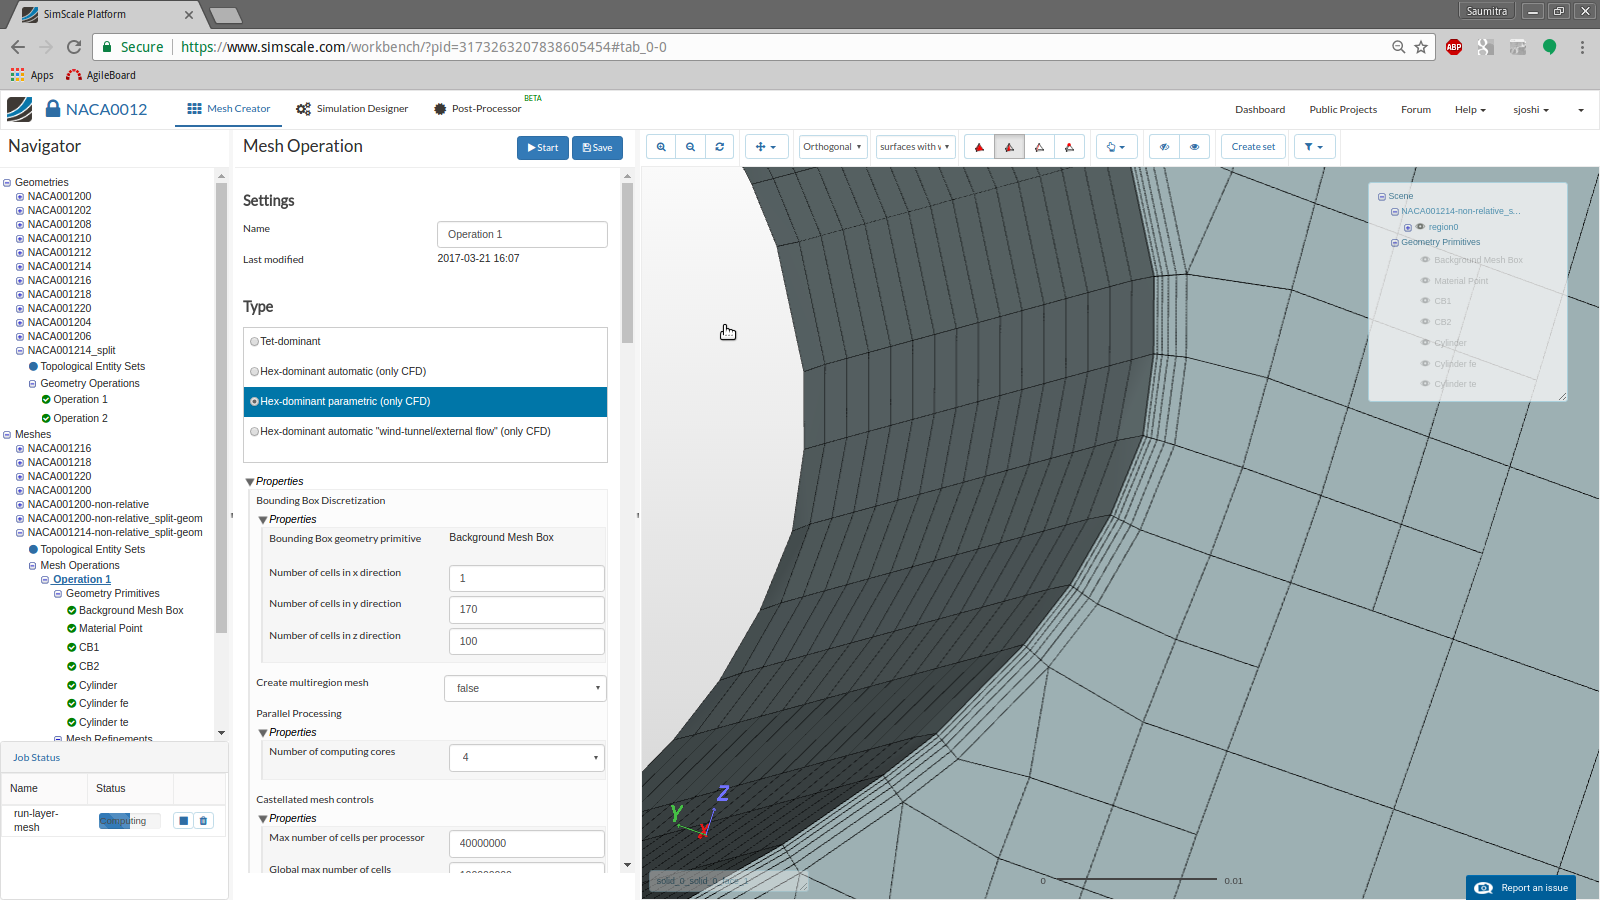
As @1318980 mentioned in his post above, the default setting for layer addition parameters is “relative” (True). Changing that to “absolute” (False) would guarantee that the numbers entered in layer refinement are absolute (in meters). This can be found in the meshing under Operation 1 → Layer adding controls → Use relative size for layers?
After these changes, 15 layers with a growth rate of 1.3 leads to too high a value for the final layer, so I reduced it to 5 layers.
Finally, the mesh quality controls place a limit on the minimum cell size - however, for this case, the layer size might go below the default min cell size of 10^{-13}. So we need to disable it by giving it a large negative value, e.g. -10^{30} . This can be found in the meshing under Operation 1 → Mesh quality controls → Min cell volume
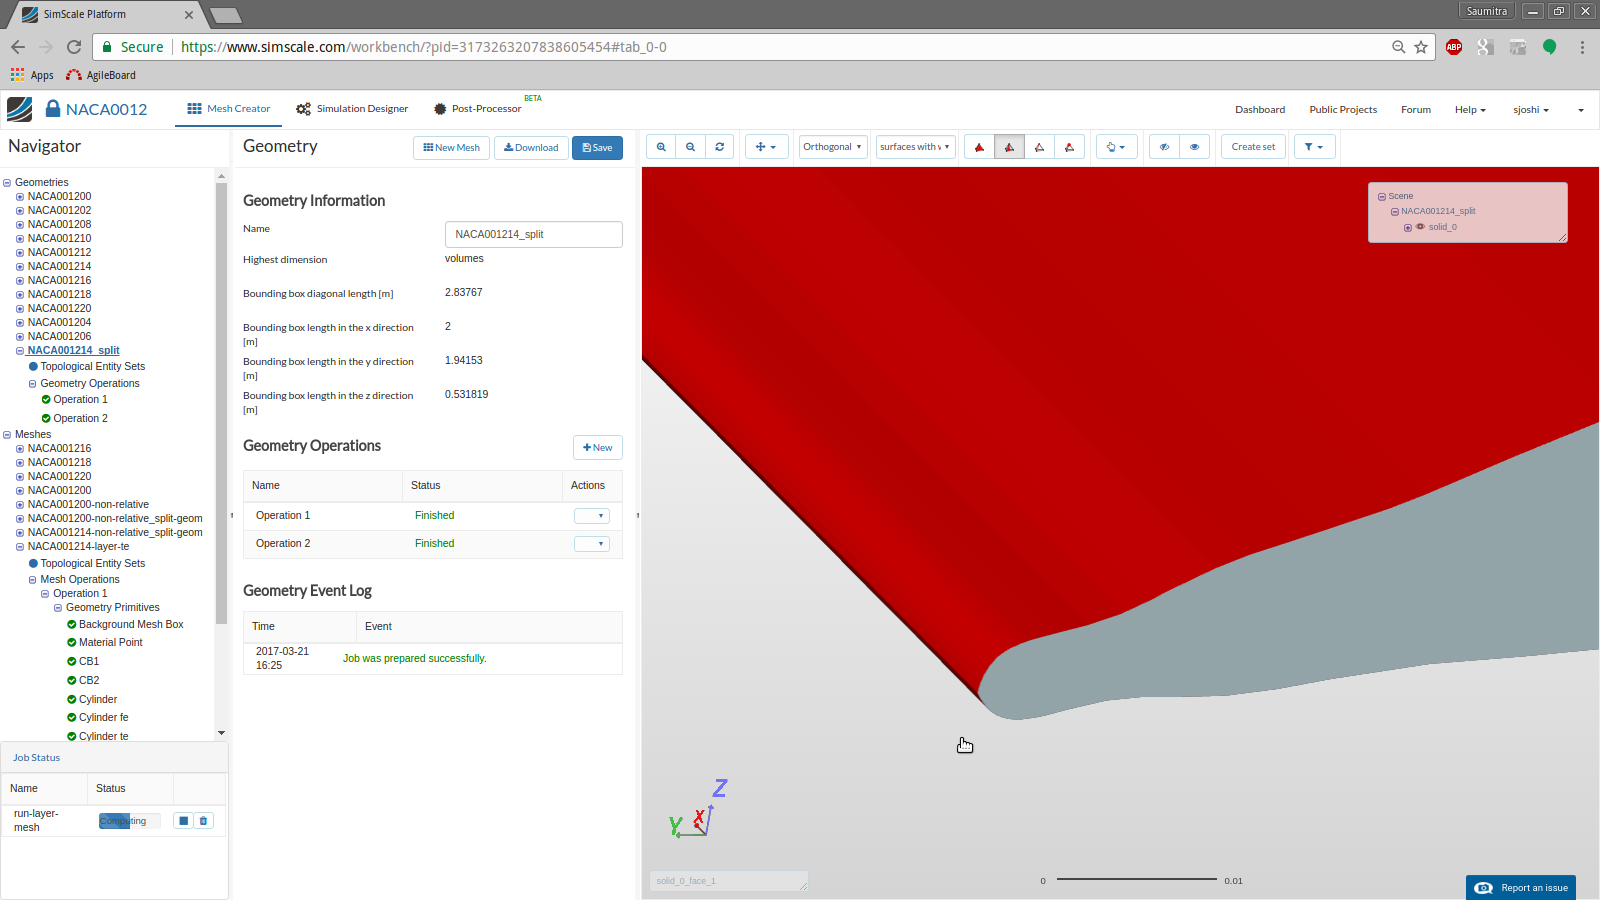
After making these changes, the mesh is generated successfully with layers. Link to project:
Another point to consider is that the trailing edge looks a bit wiggly in the geometry - it might be that this influences the results of the simulation.
Tank you very much for your advice @sjoshi and @1318980 , I will run again the simulation with changing those thing hopefully that will fix my problem.
Hi @sjoshi and @1318980, I created a new project with the changes in the mesh so the values of the inflate layer are absolute. But the values from the cd and cl still wasn’t the expected according to the Abbott and airfoil tools. Did you know if there is any other thing that I am nor doing in the proper way?
The new project is call “Final project” (atalavera_diez)


 but I can’t see how it could be. How did you calculate the turbulent inlet values k and omega?