The overall residuals I got were better than individual ones. Can you please explain what went wrong?
Hey guys, this is a new feature, right? I´m having the same issue, going to wait for someone to explain  .
.
Hi!
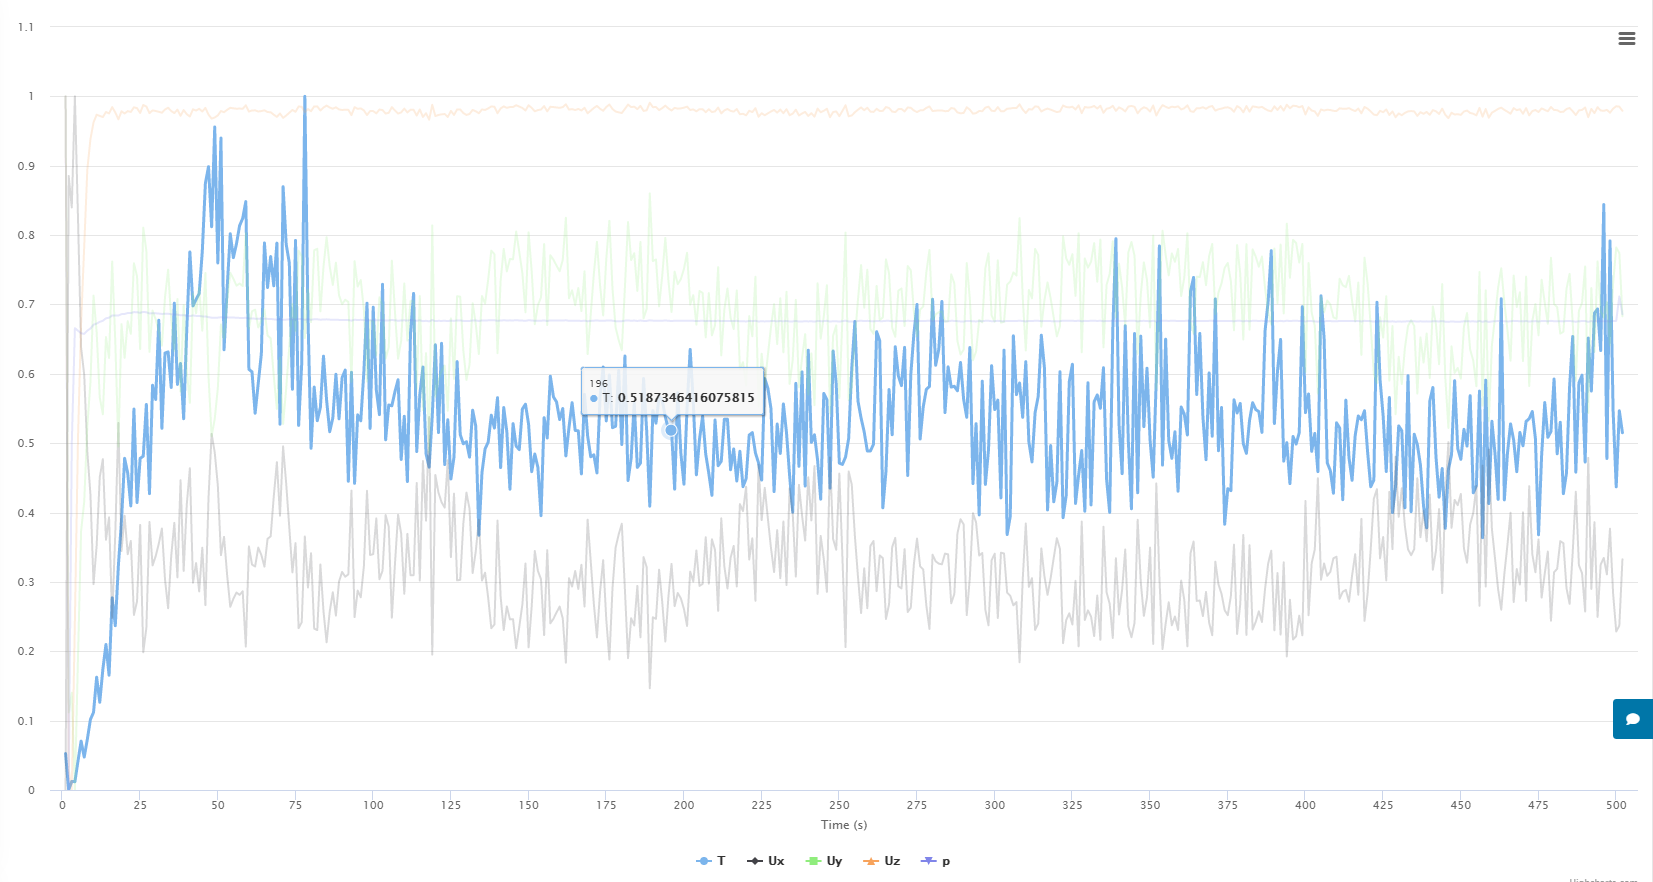
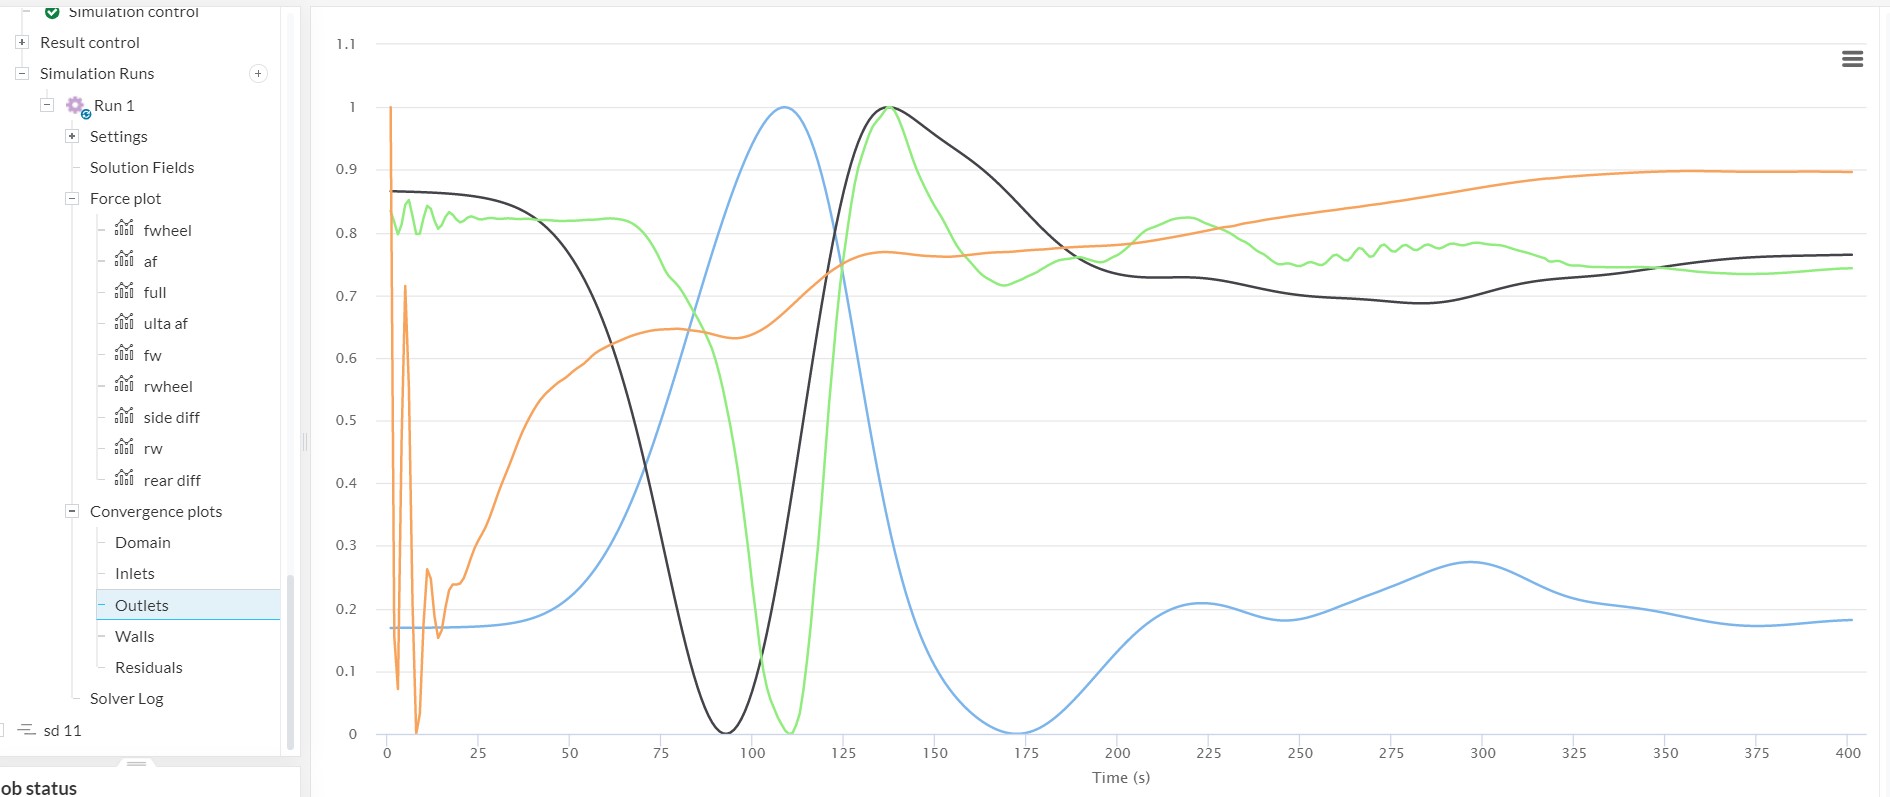
As I anticipate more people wondering if their plots are looking good or not, here are some notes about the inlet, outlet, walls, and domain convergence plots.
They don’t work exactly like the residuals plot - and the goal is not the same either. For the residuals, we naturally would like the curves to go down (the more, the better).
In the remaining convergence plots, you are seeing normalized values of each parameter at the specified boundary, so these curves will always stay between 0 and 1.
For these plots, we are actually not interested in dropping the curves to a low value. In fact, we want to see them stabilize around any value, indicating that the parameters are stable (i.e. achieving convergence).
With that being said, the image posted in the first post is actually fine - the curves are starting to flatten out, indicating that the outlet is stable. With a couple of hundred extra iterations, the curves should get even smoother.
Cheers
5 Likes