Hello all of you,
A collegue and me are working on the same model: I use SimScale and my collegue uses his own desktop based OpenFOAM system.
We are looking at a simple model: a bock of 10x10x10m.
Here is my SimScale configuration:
We are comparing several z/H curves (H=10m) over a distance from 0 to 300m.
Here is my result (I look at the colors in the Solution Fields and estimate the speed magnitude, I think with an error of 0.1m/sec).
Rel. |Speed| is the speed relative to the inlet logarithmic-ABL speed (5m/sec@10m and z0=0.03m) at the same height (z/H).
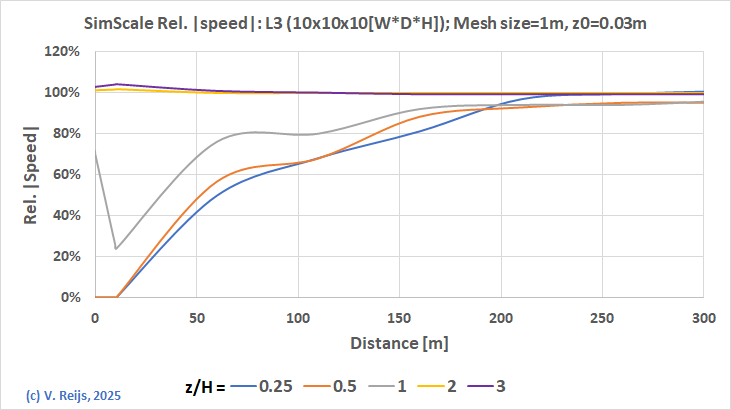
The z/H curves (at 0.25, 0.5 and 1; plotted every 50m) are always below 100%.
To be honest this is also what I would have expected (this behavoir can also be seen in Nageli’s results [see non colored curves in: Simuleren van wind bij Nageli artikel ]; although that is a wall with porosity of 17.5%).
My collegue gets the following results;

So his z/H curves (at 0.23, 0.45 and 0.9; plotted every 4cm) are always above 100%. The z/H curves are at slight different z/H than my SimScale data, but the general picture stays the same.
So which is correct?
My collegue used the ground wall roughness ks of 0.33m; I though used no wall roughness, as that gives the best horizontaly continuous behavior of speed. I don’t think that ks has such an influence (in my tests the change is marginally: see my earlier SimScale forum question: Horizontally homogeneous/constant in empty computational domain ).
Do people have ideas why the results are different? Is there something (obvious) amiss with my configuration?
Thanks for your willingness to provide feedback on my SimScale model.
All the best,
Victor