I would like to ask you how to interpret my Cd and Cl results. I was iterating meshes and simulations to get Cd and Cl very close to my references (Cd=0,87; Cl=-2,43). Every simulation gave me very close Cd, but the closest Cl is -1,40. But how to interpret these results? Are they valid? I was surprised that meshes without BL gave me almost the same results as meshes with BL and BL are not perfect maybe because of complex geometry. Y+ is mostly over 300 or one simulation is below 30. Convergence plots were a little bit unstable. But I still got Cd and Cl not far from the references. I am using Incompressible, k-omega SST, steady-state, hex-dominant, wall functions.
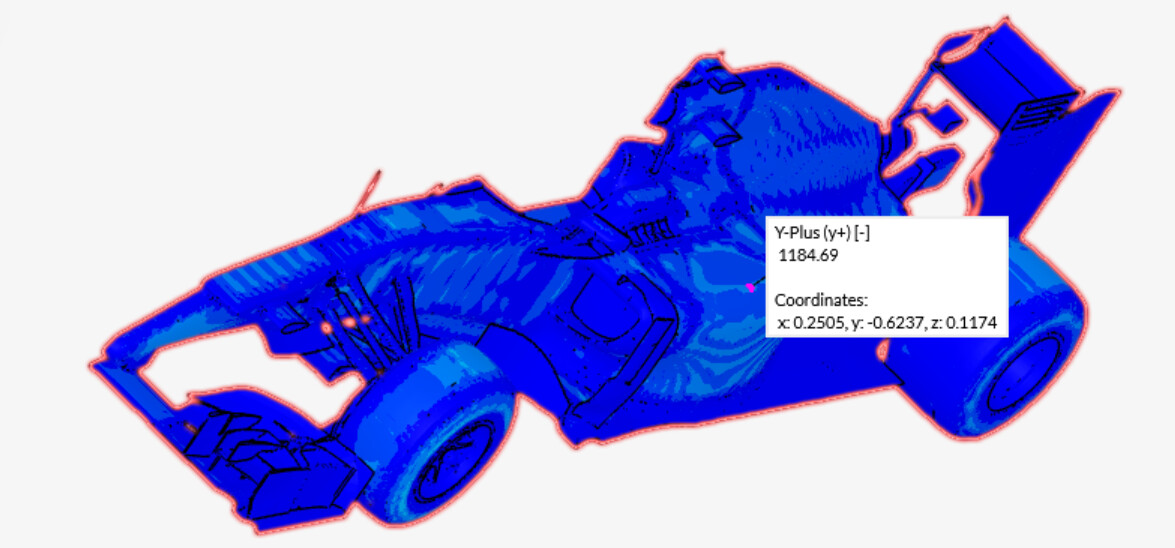
Y+ is also very similar. Y+ is mostly over 300 and one simulation gave me y+ below 30. Convergence plots are not very stabilized. But results are still not far from the references. How is it possible? I am using Incompressible, k-omega SST, steady-state, wall functions.
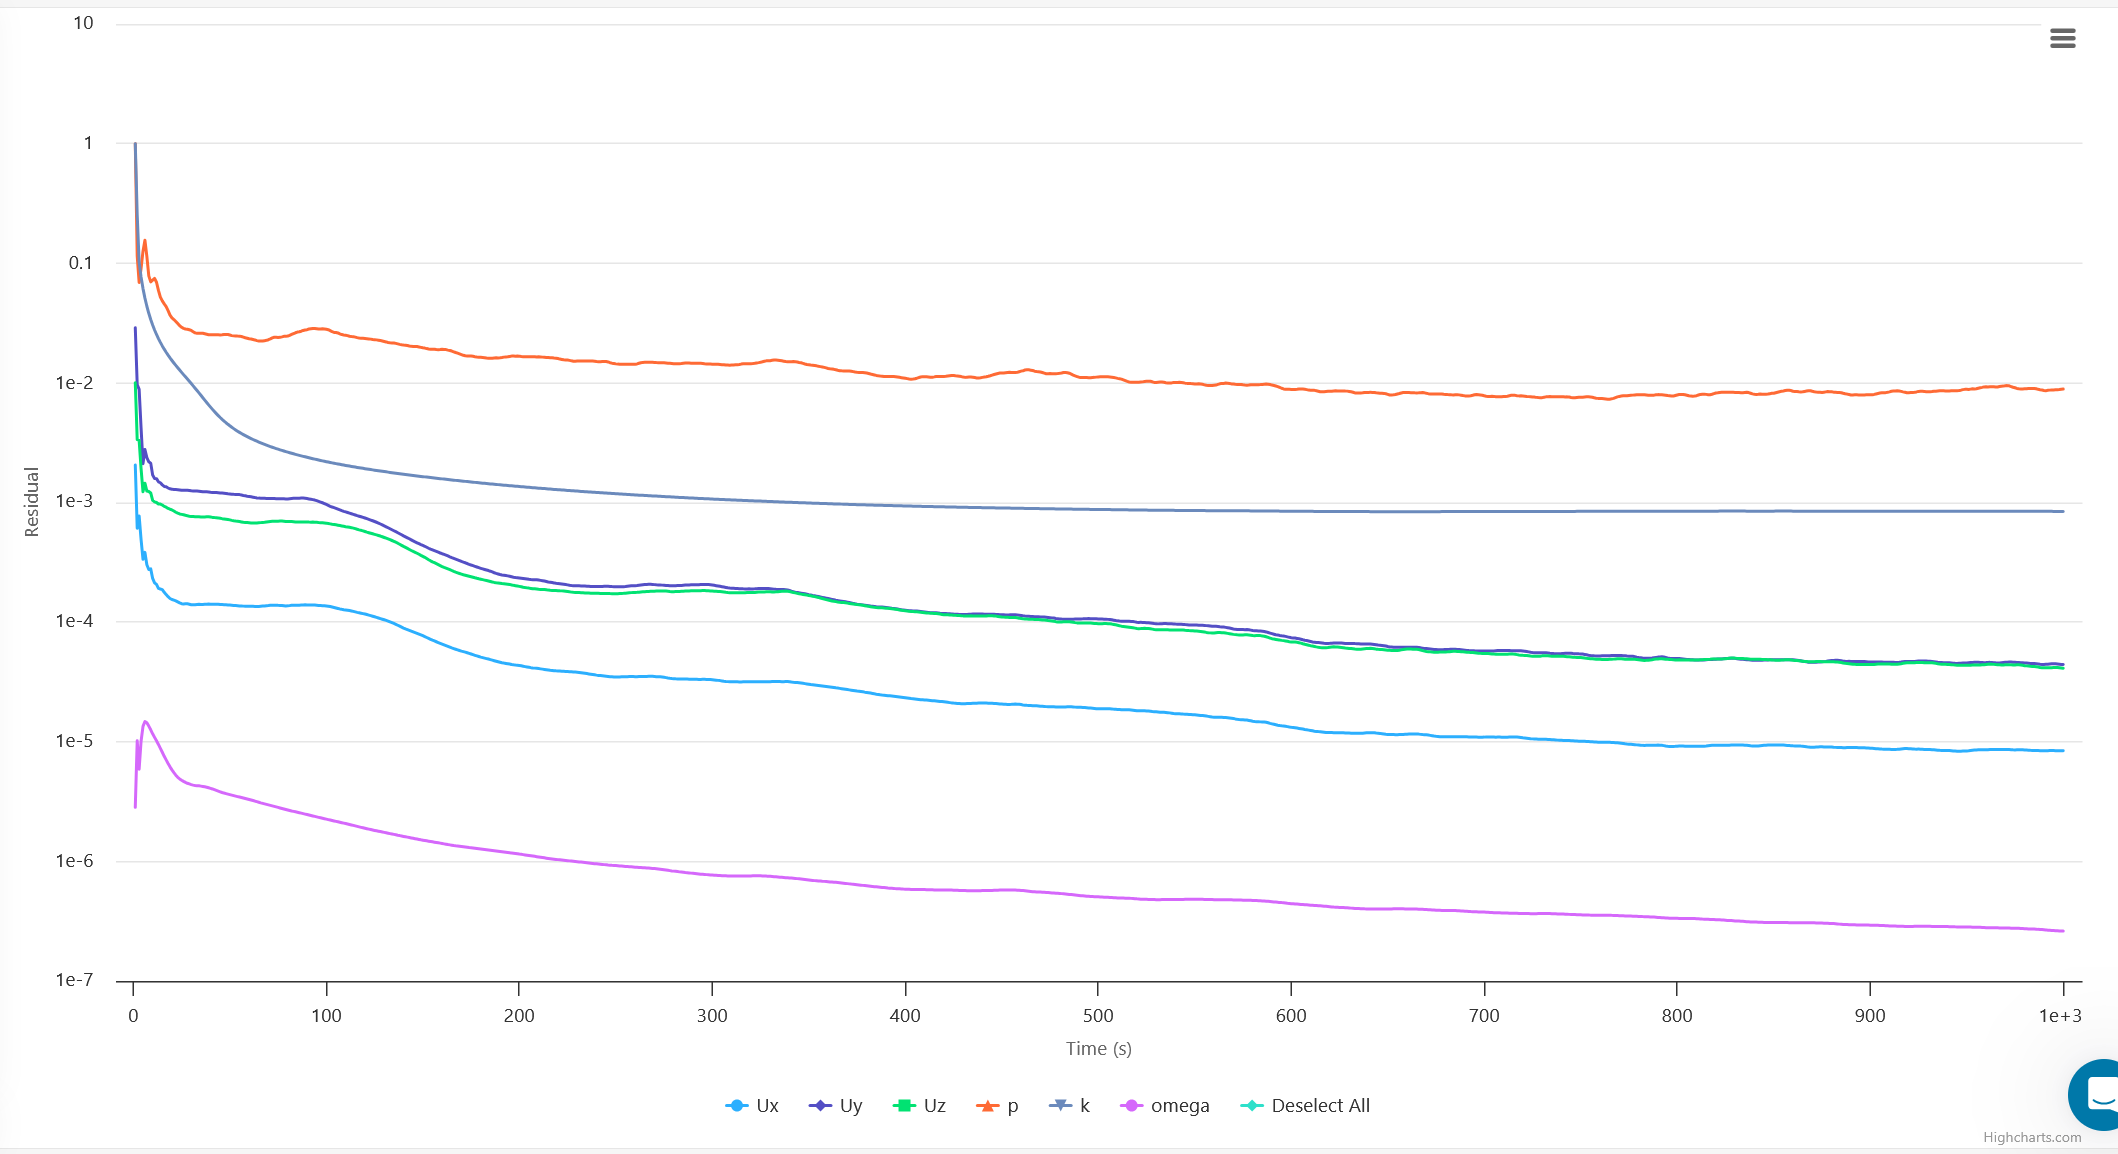
The residual plots show how well each equation is being satisfied at every iteration (i.e., the LHS–RHS mismatch). Ideally, residuals should be as low as possible, 1e-3 or lower is generally acceptable. More importantly, they should decrease smoothly or stays appx. constant. Large oscillations or increasing residuals usually indicate poor simulation.
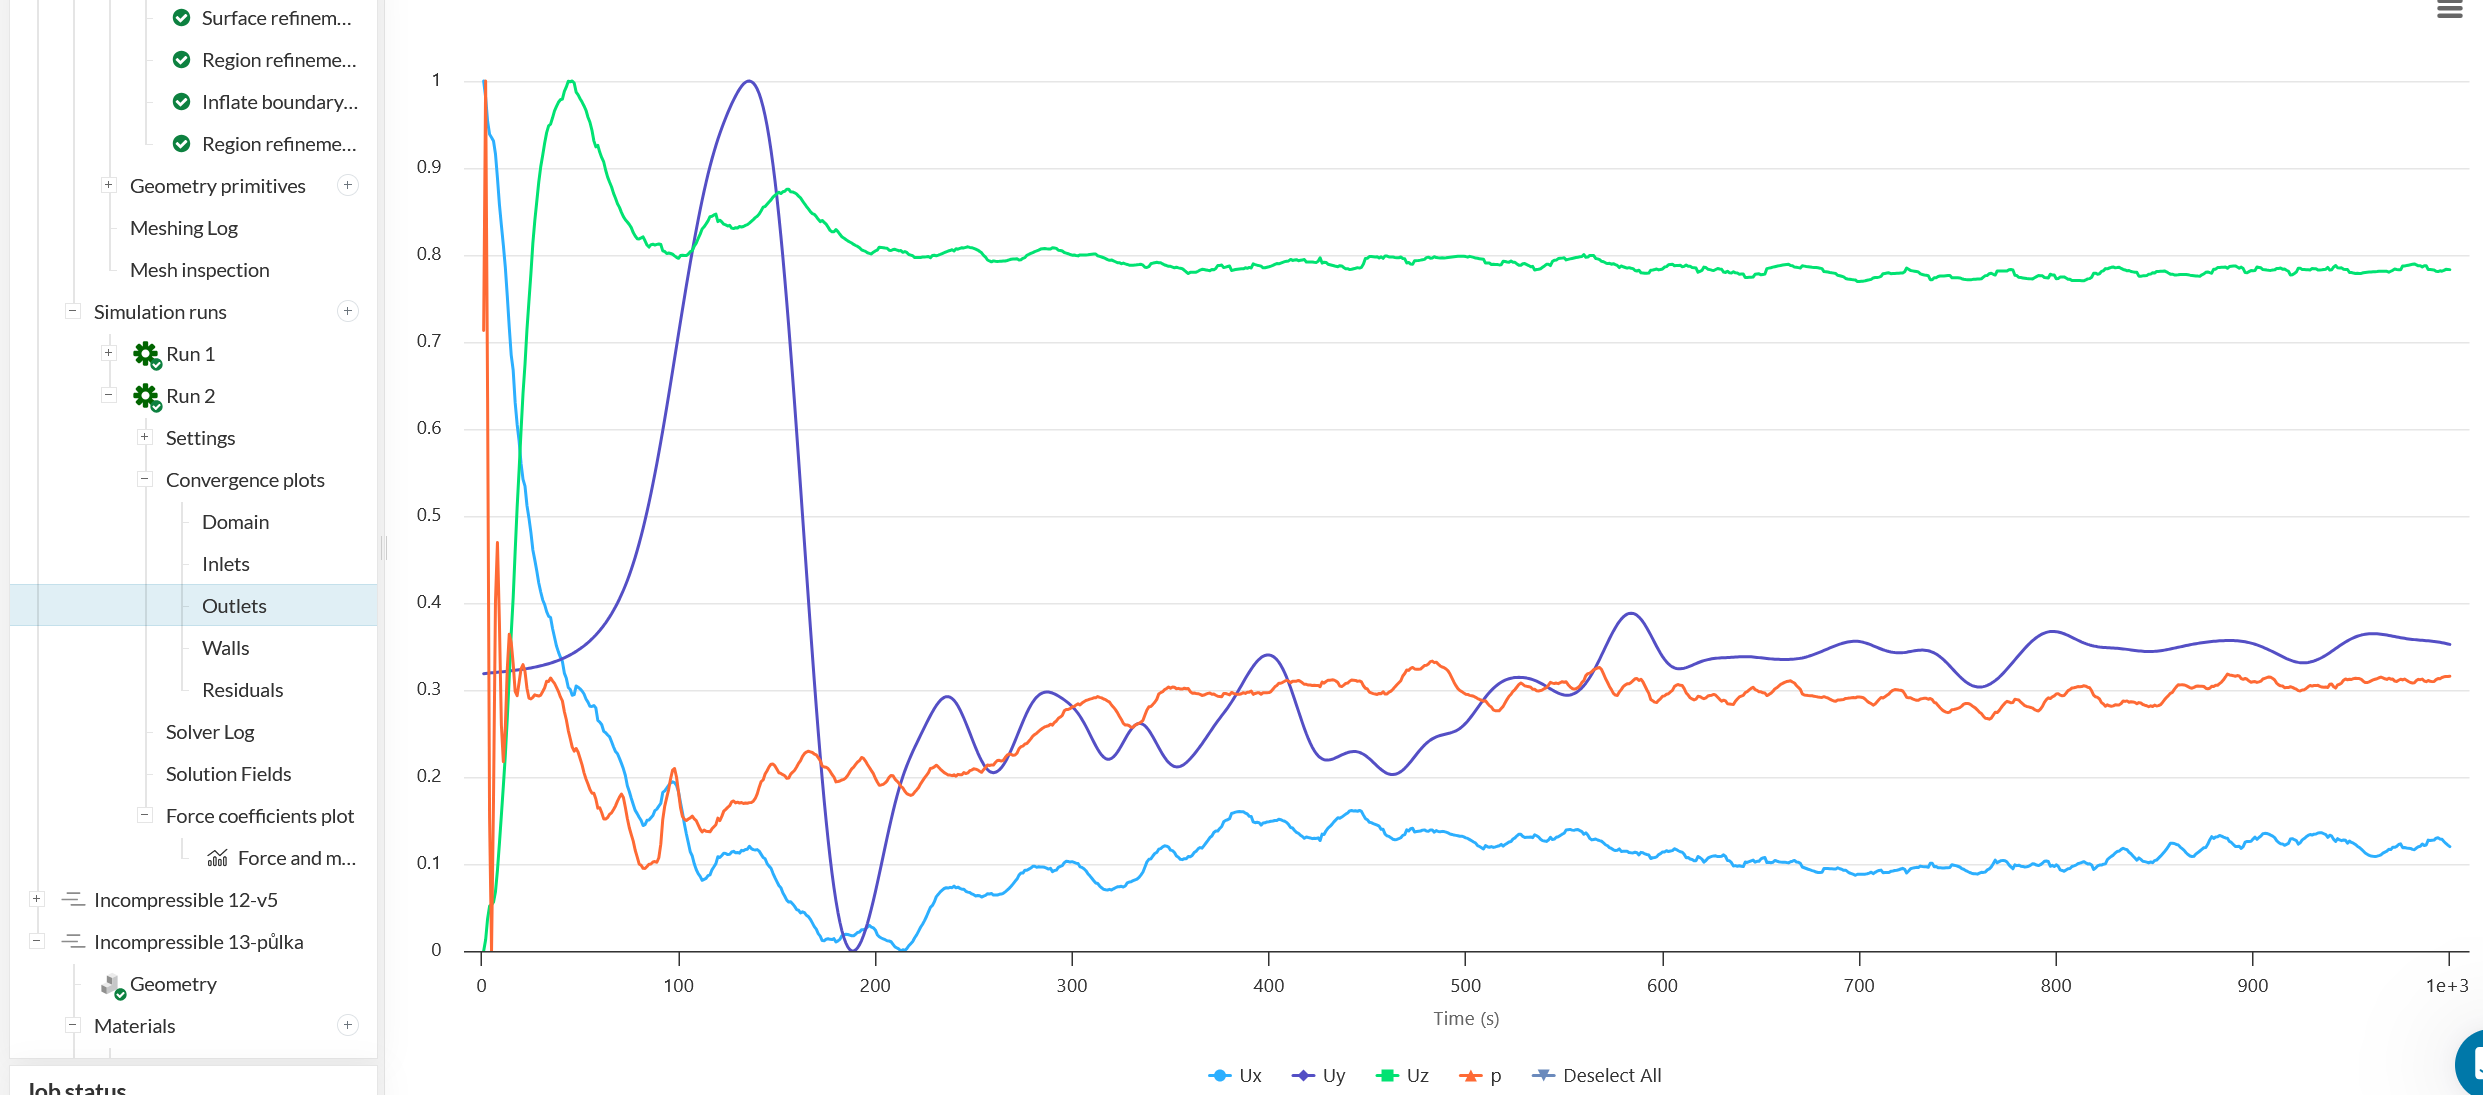
For the other convergence plots (e.g., forces, coefficients, velocities, etc), the goal is for them to stabilize with iterations. Some oscillation is normal in external aero, but it should be small.
Regarding y⁺, it measures how well the near-wall region is resolved. For k–ω SST turbulence model, you want to resolve the viscous sublayer, so y⁺ ≈ 1 is ideal (up to ~5 is acceptable). High y⁺ means that the boundary layer is not properly captured, which reduces accuracy in drag and downforce predictions.
To capture the Boundary Layer better (obtain lower y⁺), you can use this calculator to estimate the required wall spacing.