To validate CAARC building model, I need to get the pressure values around the building model edge at the 2/3 height of the building. Is it possible to get that data set or the on curve graph using the post processing tools? if so can you tell me how?
Hi @Nimantha13,
Absolutely. You can get pressure values in such surfaces of the building by both ways: as a pressure graph, and colored contours on the building in solution fields. Just add a Force plot in these 2/3 of the building that you want to analyze, and then a graph at the and of the simulation is shown like this:
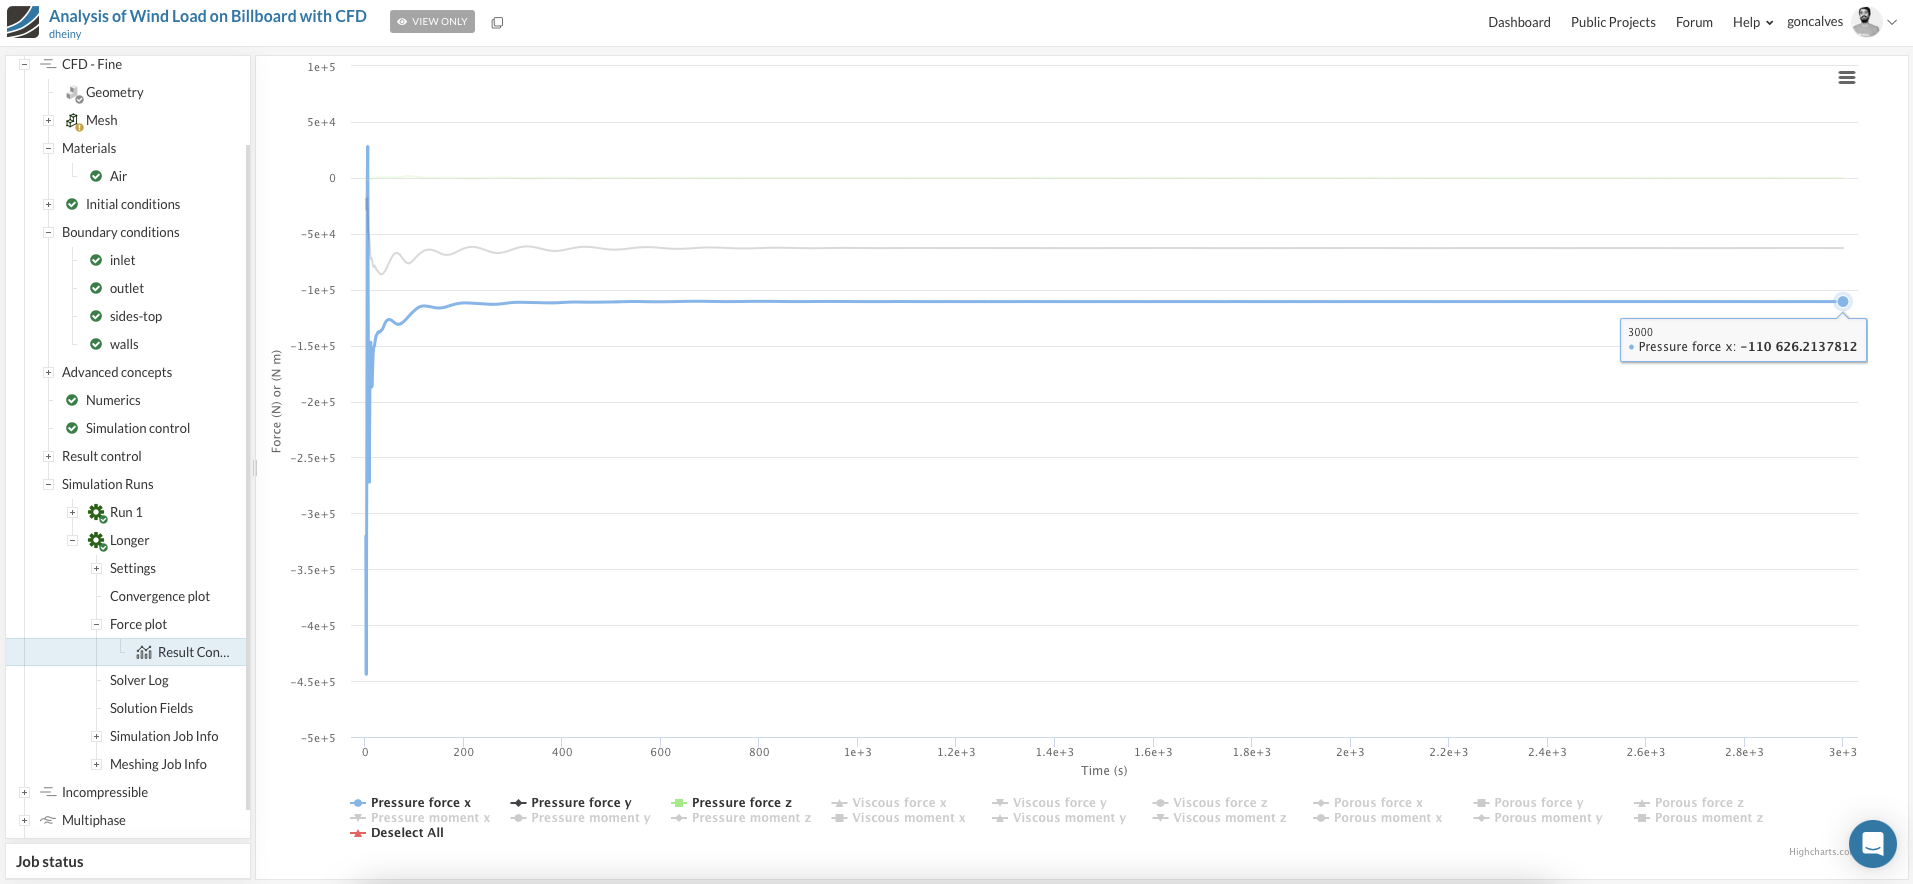
(in this case it is negative just due to the direction of the flow. and always remember that as a steady-state simulation, just the converged/last result matters).
Unfortunately we do not have a detailed tutorial showing how to set this upper a building, but I strongly recommend you to take a detailed look at this project and also use it as a guide: Analysis of Wind Load on Billboard with CFD by dheiny | SimScale
best,
1 Like
Thank you for the reply @goncalves .
I will try your method and see how it will fare. And I will take a look at your recommended project for further clarifications.
A question about the force plot. Does it only give the force at a point throughout the simulation?
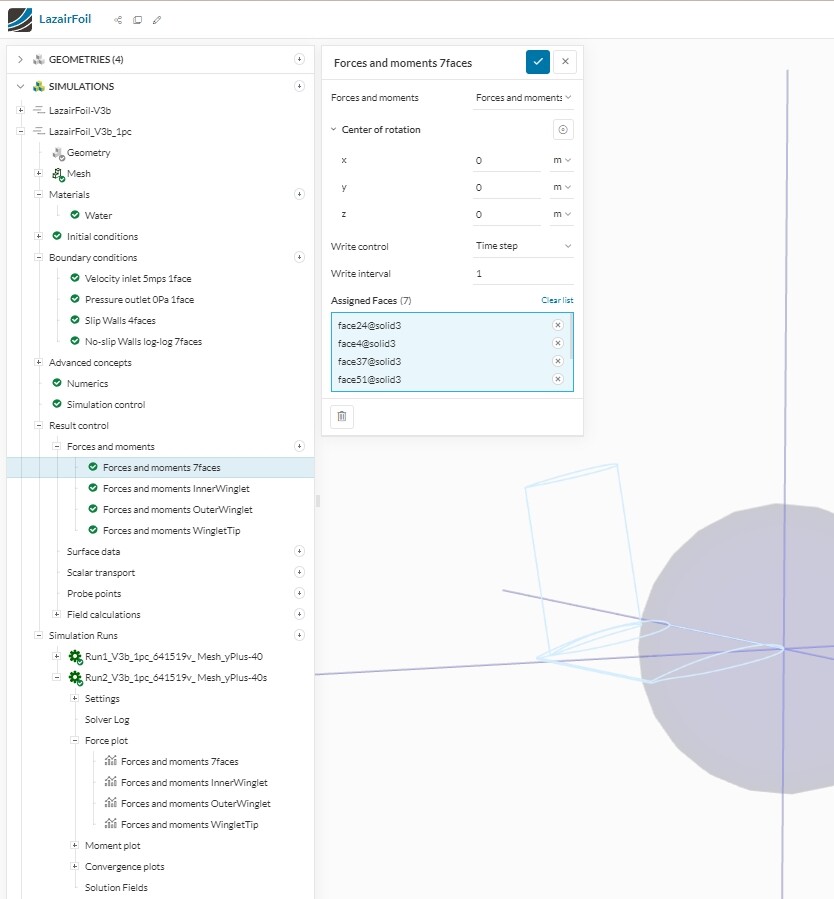
Force (and Moment) plots are generated for the surface (or group of surfaces) that you assign to your ‘Forces and Moments’ tree item in the ‘Results Control’ tree item as shown below. They are not with respect to points. :
Pressure values at points can be inspected in the post processor on a pressure plot using the ‘Inspect Point’ icon’ in the top line of the interface.
EDIT: I am sorry but your questions are a little unclear to me in your 1st post of this topic.
EDIT: If you divided the surfaces of the planar walls of the building into a one foot wide vertical band all the way around the building and then spilt that band into one foot squares, then with a ‘Forces and Moments’ results control item for each one foot square you could get the pressure at each square in lbs/ft^2 by dividing the force output magnitude in the normal direction to the surface (you can calculate that using the XYZ values of the force output) by its 1 ft^2 area. But maybe I have totally misunderstood what results you want.
2 Likes
Thank you for the reply @DaleKramer
Can you clarify these for me if possible.
1.What’s the center of rotation there then?
2.If the plots are generated for the surfaces that I assign, then is that an averaged value considering all surfaces?
3.Inspect point tool gives the pressure value but I want exact coordinate of that point in order to get the values from where I need. Is there a way to achieve that?
- CofR is for any moment calculations that you would like to have.
- Yes
- I am sure you could do it in ParaView (export your results and then open them in ParaView program) but I don’t use the SimScale post processor a whole lot so there might be a way using it.
EDIT: Please see the edit I made in my previous post for some suggestions.
Thanks again for these answers. @DaleKramer
To clarify what i need
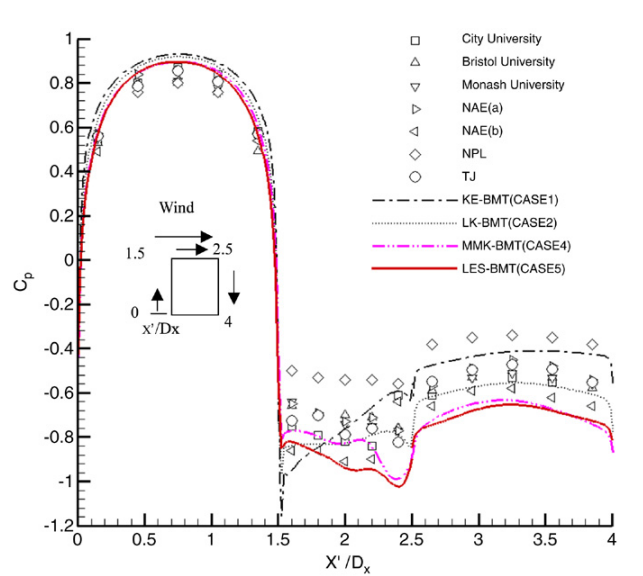
I need a graph like this. To achieve that I need pressure values (consider a building with a rectangular plan) around the edges of the plan view of the building at a specific height
Then I believe that is most easily accomplished by analyzing your results using ParaView. It is a steep learning curve but it is worth it.
Thanks @DaleKramer
Then I will try ParaView and see what happens.
1 Like