Hello,
I’m working on simulations related with the Atmospheric Boundary Layer (ABL). In these problems, is very useful to define a roughness of the ground because this represents the obstacules, topography and characteristics of the terrain. I’ve been testing many values of roughness lenghts in my projects (mainly in Test Roughness Lenght), but in all the cases, the results of the simulations are exactly equal for any value of roughness lenght (even for a smooth surface)
This problem seems to be common in OpenFoam and exists discussions about this in forums. The general recommendation is that the height of the middle of the first cell must be greater than the roughness lenght, otherwise the Solver applies the wall function for smooth surface. However, I respect this rule and I still can’t obtain different results according the roughness lenghts.
If you know what can be my problem or there is a public project on SimScale that applies diverse values of roughness lenght succesfully, i would very grateful!
Best,
Carlos Ramírez
Hi Carlos,
Thanks for posting your question and welcome to the SimScale forum 
Let’s see if we can get to the bottom of this. Tagging our OpenFOAM experts @psosnowski2, @Ali_Arafat, @dylan, @gholami
Hello @Carlos_Ramirez,
It is a bit difficult to comment on results when I am not sure if I look at the right ones.
I investigated your project Test Roughness Length, and in detail Simulation 1.
The smallest cell volume you have for the mesh of this simulation is 0.001, which gives the length of volumes cube of 0.1, so the cell center lies 0.05m from the floor.
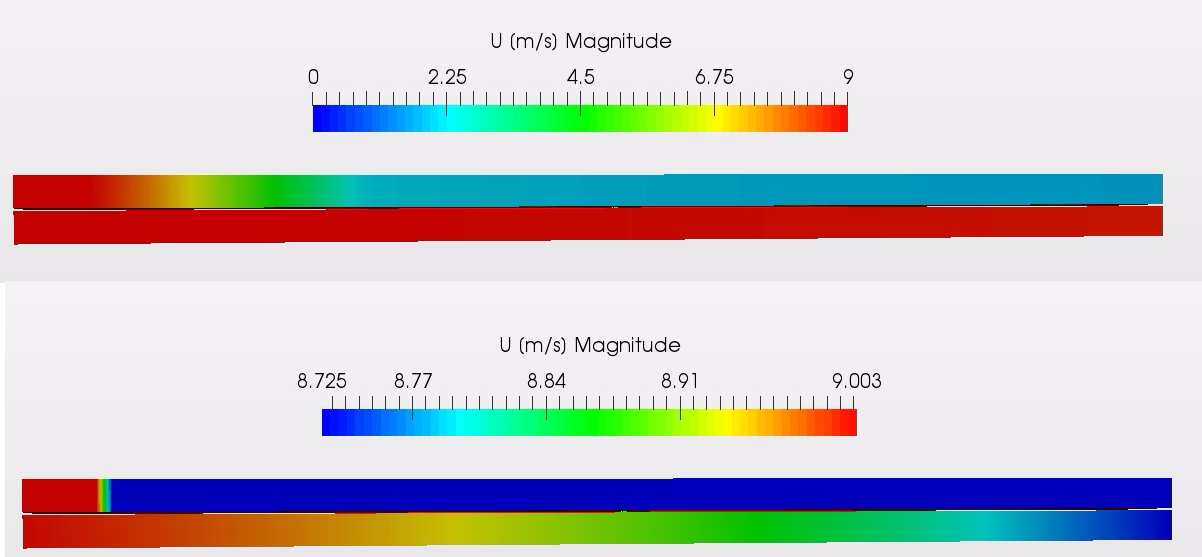
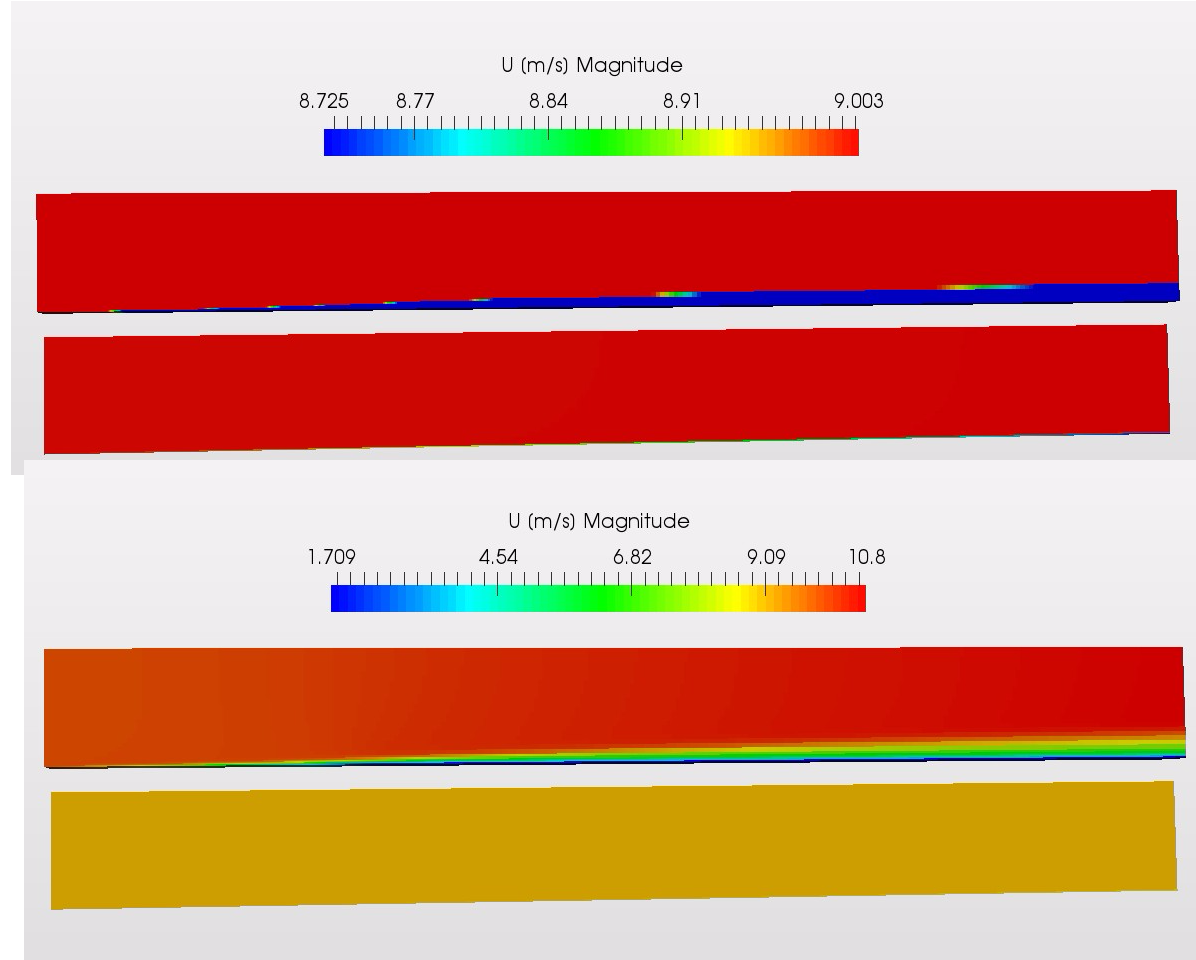
Only two runs had the roughness height smaller than this value: Run 1 and Run 7. Comparison of velocity profiles are show in attached figures (Two color scales for ease of comaprison). The results seem to match the model.
Please let me know if this clarifies the issue.
Best,
Pawel
(in case of the runs 2-6 the lengths are higher than cell size).
Hello @psosnowski2,
Thank you for your reply and for your time spent in my question!
I should have been more specific with the results that I used to ask my question. In the Simulation 1, I made many runs changing parameters in disorder, testing the effect of the roughness length (I established higher values than middle of the first cell on purpose) and changing the velocity on inlet. In fact, the velocity in the Run 1 is 9 m/s and in he Run 7 is 1 m/s. I think that the differences in these are due to this parameter.
In order to make a effective comparison, I have a case named “Blocken Simulation Quasi-2D” (following a paper of Blocken), in wich I used the same Boundary Conditions and only the roughness lenght is changed. They are in these simulations where I always obtain the same results despite the change in roughness.
If you can review these cases, I would be very useful.
Many thanks again!
Carlos Ramirez
Hello @Carlos_Ramirez,
Thanks for the clarification. Indeed, in the simulations you mentioned the results seem not to be different. Although I would remain open to the possibility that it is the model that distorts the analysis, here are some notes that might also be the case.
First thing I noticed is the use of semi-2d mesh. This is somewhat legal (in a physical sense), thought we are applying 3d models to a restrained system. Immediately it points to the 3-dimensional nature of turbulence. This kind of meshes are in fact used in OpenFOAM, but they need a specific definition on the mesh structure level. It is not available at the moment in SimScale online meshers (you could download the mesh, manually change the polyMesh/boundary file, re-upload the mesh and use 2D-empty boundary condition for a 2d simulation).
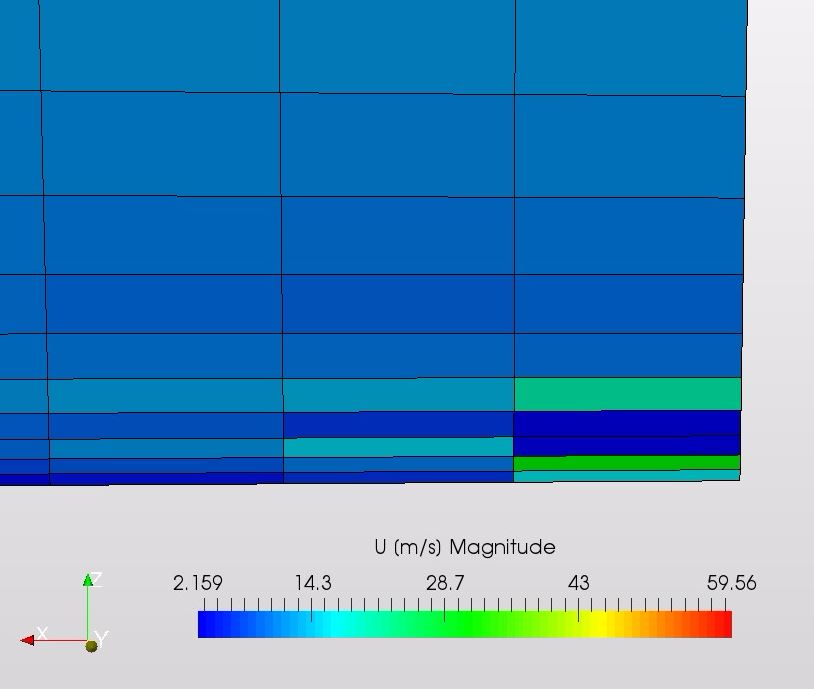
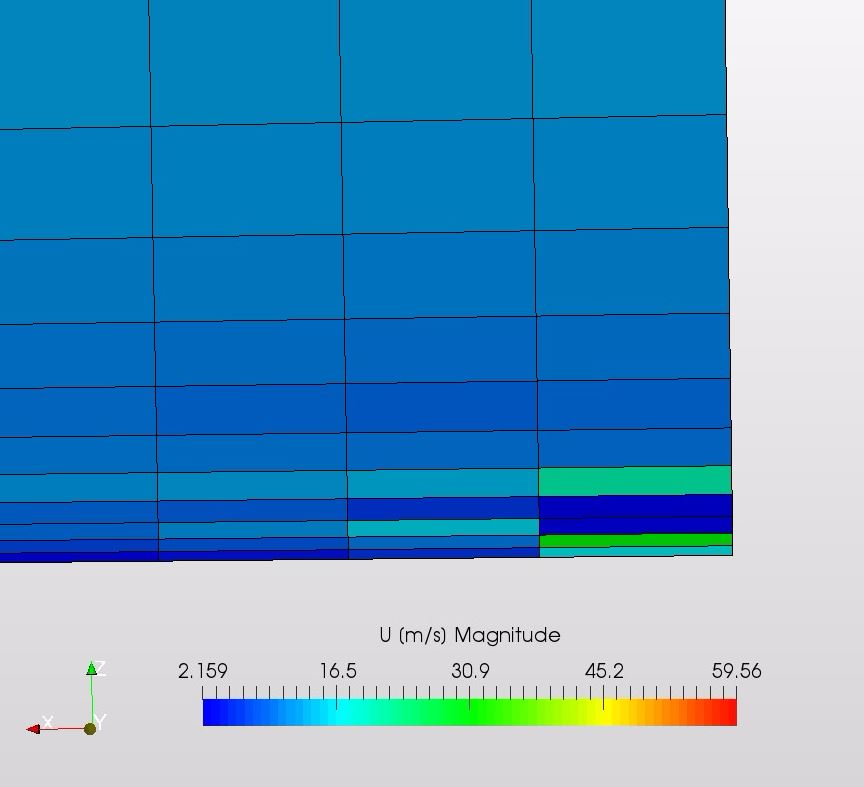
Next thing that drew my attention was the behavior of the flow field near the inlet (see figures below). We expect some unstable behavior near the inlet, but this seems quite strange. I would again attribute it to the semi-2d mesh. (this is an assumption)
Finally, lets consider the size of the system. The block of air is 500m high, and wind blows max with 18m/s. Now, our roughness changes it’s height from 0.24m (Run 1) to 0.01m (Run 3). Although this is a significant absolute difference when you compare the two, if we compare these values to the size of the whole system, they are changes are not that big. (Here I have to make a disclaimer- I have not deeply investigated the roughness model, nor did I look for scientific references regarding the expected behavior of the system).
To sum up, having seen the differences in flow patterns in Simulation 1 (I am pretty sure I compared 2 simulations with same inlet velocity), I would still be hesitant to blame the model for lack of expected results.
First I would check the system’s behavior on a 3d mesh (also with symmetry conditions, but given few dozens of cells in the Y direction), and by using bigger differences in roughness relative to geometry height (say 0.01m vs 1m?)
Hope this moves the study forward!
Best,
Pawel