Hello everyone ![]()
I’ve a general question about the analysis of y+ Plots.
The general basics of y+ and the structure of boundary layers are already known to me.
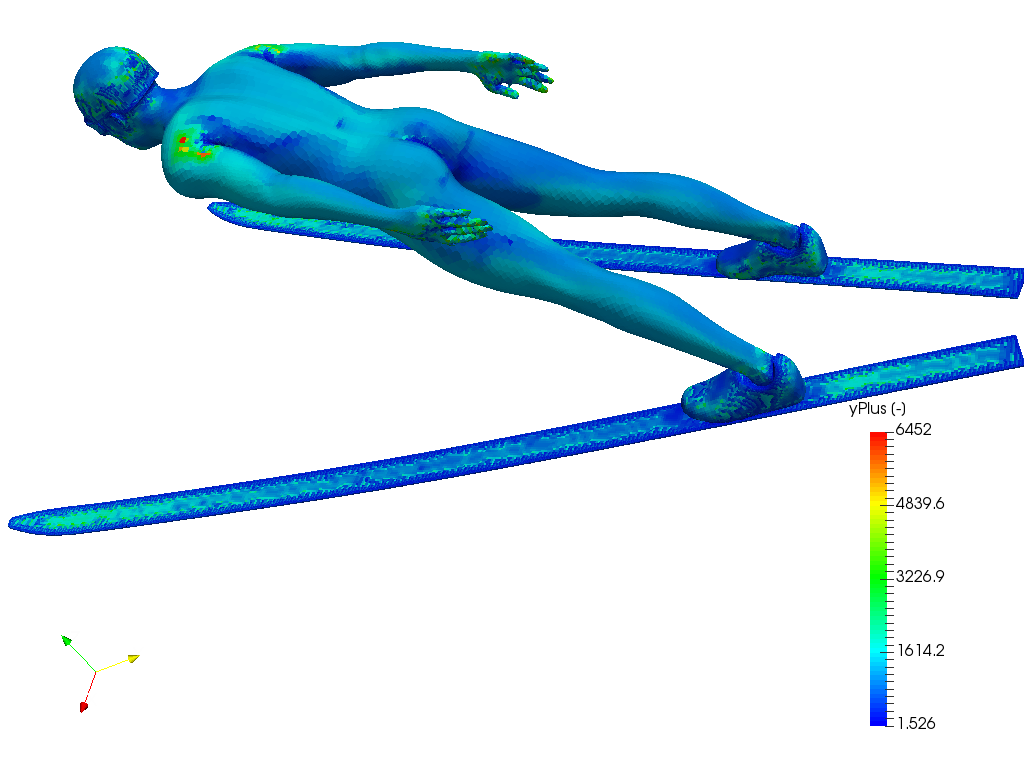
In the first homework of the Sportsworkshop we had to calculate the standard results (p, v, …) and y+ values in addition. In my case, there is a y+ = 6452 as maximum, at a total range between 1.526 and 6452.
To the Project
As far as I know, y+ should be for Low-Re resolution for resolving the wall treatment close to 1, alternative for a logarithmic-based wall function between 30 and 300(+) and the area between 10-15 should be avoided, because of the transition at y+ = 11.067.
The Re number in the case of the ski jumper must be significantly larger than 1e7. But at High-Re resolutions and y+, unfortunately I’ve no idea.
The simulation itself based on an incompressible fluid flow, k-w-SST turbulence model and a steady-state.
Now I’m not sure about the analysis of this resolution plot.
What can I learn from the solution field of y+ itself and in comparision to the y+/u±Plot?
I hope someone can give me a hint. ![]()
Greetings from Berlin(GER)
Mario