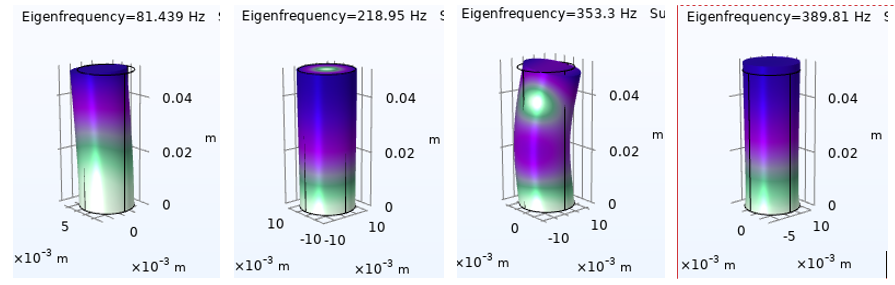
Thank you very much for the reply. Unfortunately the results still are so wacky as to be uninterpretable, even with the scaling factor set to 0.01.
With other software I have been able to produce results such as the plots shown below. Is there any way to replicate this with SimScale? I work exclusively with soft materials, with Young’s moduli less than 100 kPa.