TET meshing is now strongly irregular, but was OK 1 month ago

Hi @jprobst,

I used that NACA0012 ‘pseudo 2D’ study as an easy to follow example (having good mesh available). But I did notice problem with ‘normal volume’ TET meshes with my Magnus Effect Study, while TET meshing with auto BL and HEX (Simulation ThomCyl_TET+HEX).

Please look at mesh on left / right sides in corners below the ‘plate’ or ‘disk’. Left side is strongly squeezed, right side looks correct.


Domain looks better, but you will see the squeeze places on top (but not on bottom of that domain):


Anyway thin domain reveals the problem to full extend. I used that mesh helping for best (doing, in mean time, Ahmed body study and Tesla Truck), but now I have to put TET mesh on hold, awaiting the fix.

Thank you,

Retsam

@jprobst, it appears that you have the ear of the meshing software provider. Perhaps you could inquire about how hard it would be to add the following ‘standard’ algorithm meshing parameter which I present here:

A few of us have spent hundreds of hours in the last few months struggling with trying to have projects using the ‘standard’ TET mesher, verify experimental data… We have determined that one of the main issues causing poor verification, is the existence of ‘bad’ cells in our ‘standard’ TET meshes. The issue of this topic also confirms that.

Now I am taking a break from CFD and working on some FEA also using the ‘standard’ mesher.

Since it appears that FEA has similar mesh quality requirements, today I came upon the idea of a ‘standard’ meshing parameter that could really help us zero in on proper mesh settings with minimum time and effort. This parameter would also reduce ‘bad’ cells in our mesh to unheard of low levels at the same time…

Here is the request:

  • Instead of (or in addition to) having a ‘Maximum edge length’ parameter, give us a ‘Maximum tetEdgeRatio’ parameter…
    .
    .
    .

Also, for those of us who continually monitor the ‘Meshing log’ to determine how a meshing is proceeding and whether we should cancel that mesh and change a parameter so that we do not waste core hours while trying to determine the needed fineness of our mesh etc… Could you add code, in the SimScale UI, so that on ‘every meshing log screen update’ (which is every minute or two or when the log text actually changes), do this:

  1. If the log text has changed, add a timestamp at the end of the last line of the log…
  2. On every screen update, edit/add to the UI screen Meshing Log window, a separate timestamp line. This would mean that if log text did not change on a screen update, you would still see the timestamp update (with realtime and core hours if possible).

Here is a fake idea of what the log would look like using those timestamps:

1 Like

As ‘standard mesh’ evolves without any warning, I also suggest to put a mesher version in the header of log file. It should reduce our anxiety about source of discrepancies when back to the project with updated mesher.

1 Like

But please put that Version # at the End of the mesh log since the beginning of the log disappears forever on meshes with many faces :frowning:

Or better yet save the whole mesh log for us…

I would venture to say that it would be almost a necessity to have the version # in the mesh log in order to debug situations like this… It is fortunate that Retsam stayed organized well enough to discover this issue that appeared ‘out of the blue’ to us in the field so to speak :frowning:

EDIT: Sorry, even with unlayered 2177 face mesh I did today, the ‘standard’ mesher log file was not truncated, I think this post is only relevant to Hex meshing log files that show only the last 1500 lines.

Well, TET mesh is still called standard, but unless it is mended, it seems unusable:

I could comment, but you can say yourself: Holly s! what is it? My answer is: I do not know.

Forwarded the issue Andrzej, one of my colleagues might jump into the discussion to clarify some things here.

Best,

Jousef

Hi guys, thanks for reporting.

We’re still on it (as a matter of fact - right now). We understand the issue and we can assure you that this is generally harmless: it’s not a bug in the mesher and it should also not impact the results negatively (but please read the caveat below).

What’s happening here is the following:
Because we want good meshes, we are applying relatively strict quality criteria. The mesher is configured so that it refines the mesh in areas where it cannot meet the quality criteria of the mesh. This is what causes the refinements in the first place.

Generally, the meshes with the refinement have better quality than without. However, they also have more cells - and sometimes they have more cells than needed. This is problem number 1.

Problem number 2 is that the variance in mesh fineness also affects the condition of the matrix in the simulation. This means that the behaviour of the solver changes (the meaning of the residuals change) and this is possibly the cause for different results, at least if the simulations aren’t fully converged.

If you observe differences in results, one thing to look out for is to ensure that the result is actually converged. Residuals are one way to check that, however I strongly recommend to use result control items (e.g. probe points, or forces) to judge whether or not a result is converged.

We’re right now working on an improvement for the situation. Probably we will go back to less strict quality metrics, which means that mesh quality will become slightly worse again (and again, that’s not an accident, or a bug, but a conscious design choice motivated by a trade-off between mesh size and quality).

In the meantime - sorry for the inconvenience, guys. We really didn’t want to break things for you.

Johannes

2 Likes

Hi guys
we have just released a fix for this problem. I hope we managed to improve the situation a bit. Please let us know if it helps in your cases, or if it makes anything else worse.
Thanks for reporting this and sorry that it took so long - we had a lot going on recently.
We’re committed to providing you with a tool that just works, and your feedback has been always very helpful. Keep it up!
Johannes

1 Like

Hi @jprobst: Thank you for providing a possible fix to standard mesh random skewness. I immediately tried it on my NACA0012 simulations (angle 11.15 > N0012_11.15deg_5.95MR_T2). I see now, that mesh is indeed not skewed randomly and resembles meshes I created on end of 2019.

However, keeping all parameters the same for simulations (Run 2 and Run 4 can be campared), gives following differencies:

Run 2 (mesh from 2019)
forces forces1 output:
sum of forces:
pressure : (1.10111025524 0.000398966314668 107.949038339)
viscous : (0.220256463195 -5.08671774776e-05 -0.0308278300759)
porous : (0 0 0)
sum of moments:
pressure : (0.863304918945 -0.181507031234 -0.00919426096133)
viscous : (-0.000282952642919 -0.000987897236667 -0.00171935167925)
porous : (0 0 0)
forceCoeffs forceCoeffs2 output:
Cm = -0.00210282921267
Cd = 0.0152256753623
Cl = 1.24350614857
Cl(f) = 0.619650245072
Cl(r) = 0.623855903497

Run 4 (fixed mesh 2020)
forces forces1 output:
sum of forces:
pressure : (1.98800188859 0.000284227679948 106.485766884)
viscous : (0.202973864501 -0.000768985824991 -0.0336274084459)
porous : (0 0 0)
sum of moments:
pressure : (0.851998340265 -0.172460051419 -0.0160815259606)
viscous : (-0.000276639806955 -0.00384372444654 -0.00161970838745)
porous : (0 0 0)
forceCoeffs forceCoeffs2 output:
Cm = -0.00203149059155
Cd = 0.0252458950857
Cl = 1.22661309285
Cl(f) = 0.611275055833
Cl(r) = 0.615338037016


That difference in drag forces / coefficients is very important and would mean that my results for AoA of NACA0012 <= 10 I crafted with ‘precision’ will be not reproducible, as drag can be bigger by > 60%.

Here is the link to NACA0012 study I did: NACA0012 airfoil study using standard mesh.

Cheers,

Retsam

Hi @Retsam
thanks for trying it again so quickly! I’m glad that the mesh is more regular now.
I just took a look to check why you’re getting so different drag values now. I have checked the setup and the results. One thing I noted is the appearance of the boundary layer.


I would recommend to try with more layers (4-8). The y+ values should be outside of the range between 5 and 30 (i.e. avoid the buffer layer) to allow the wall functions to work properly. It seems to be satisfied in most of the surface of airfoil. Another thing which could be worth a try is to use a low-Reynolds grid where all y+ values are below 5 (as low as 0.1 for a true full resolution of the boundary layer) on the entire airfoil.
I hope this will give more consistent results.
Johannes

1 Like

Hi @jprobst

Thank you for offering your (well, standard) recommendation about meshing. I followed them for first ~9 months with SimScale, but being asked to check how well new ‘standard’ mesh (TET) behaves, I joined @DaleKramer and @Ricardopg on a separate channel (RocketChat), were we spent hundreds of simulation hours trying to match, to some extend, NACA0012 experimental data from NASA, and using TET and HEX meshes.

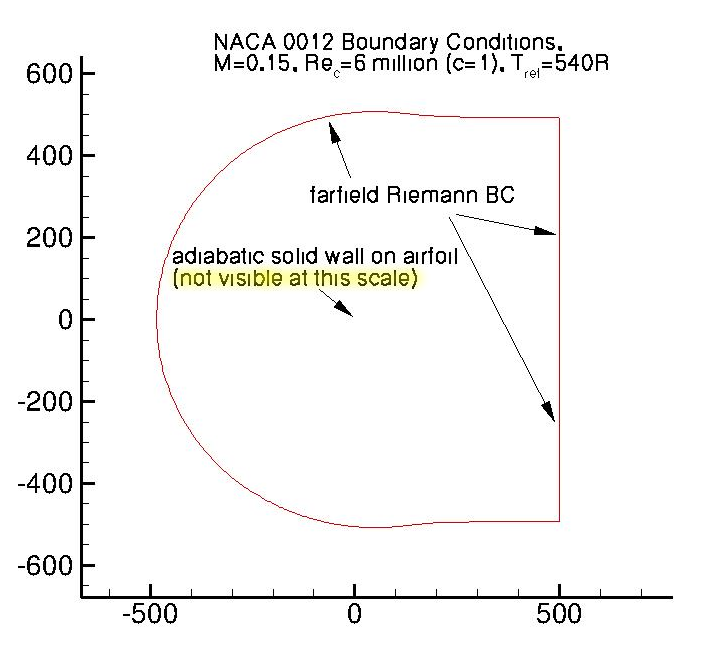
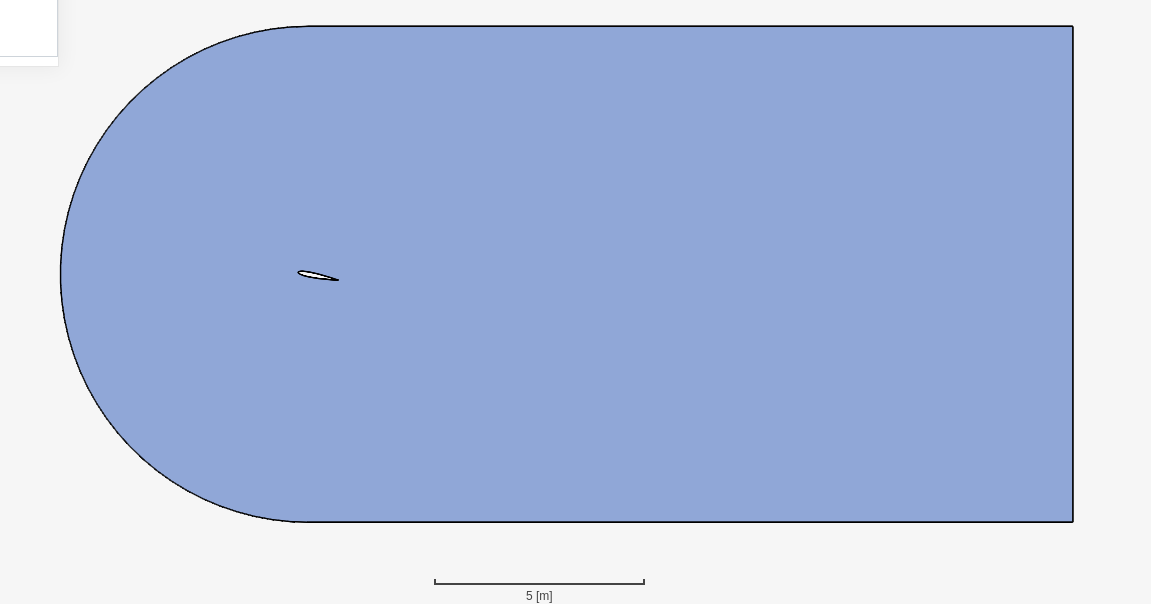
My objective was to make kind of ‘essential’ setup with smallest possible domain and minimal number of tweaks from Numerics.

While meshing for Full Resolution (y+1) I tested up to 64 BLs: even if Lift coefficient was in line with experimental one for many AoA, Drag coefficient was never approaching any. Convergence was steady or near ideal for those simulations.

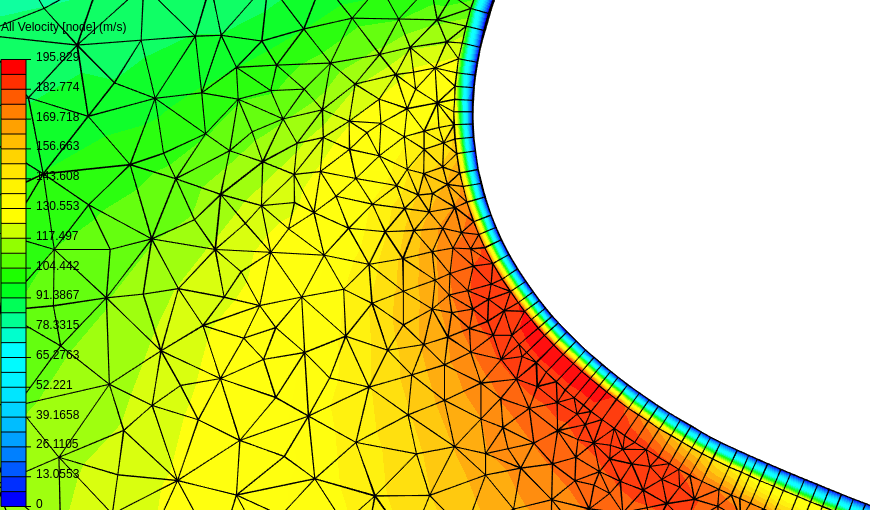
While meshing for Wall Function (k-omega-STT) (y+30) I tested many layers, but found out, that Drag Coefficient is getting better and better when reducing the number of BLs and allowing Wall Function to take care of y+ > 80. I went to study Xfoil 2D meshing approach and with a hind side from pressure gradient study (in Xfoil), applied a ‘patch’ on a part of the airfoil face, allowing to handle high pressure gradients with much denser 1 layer BL.

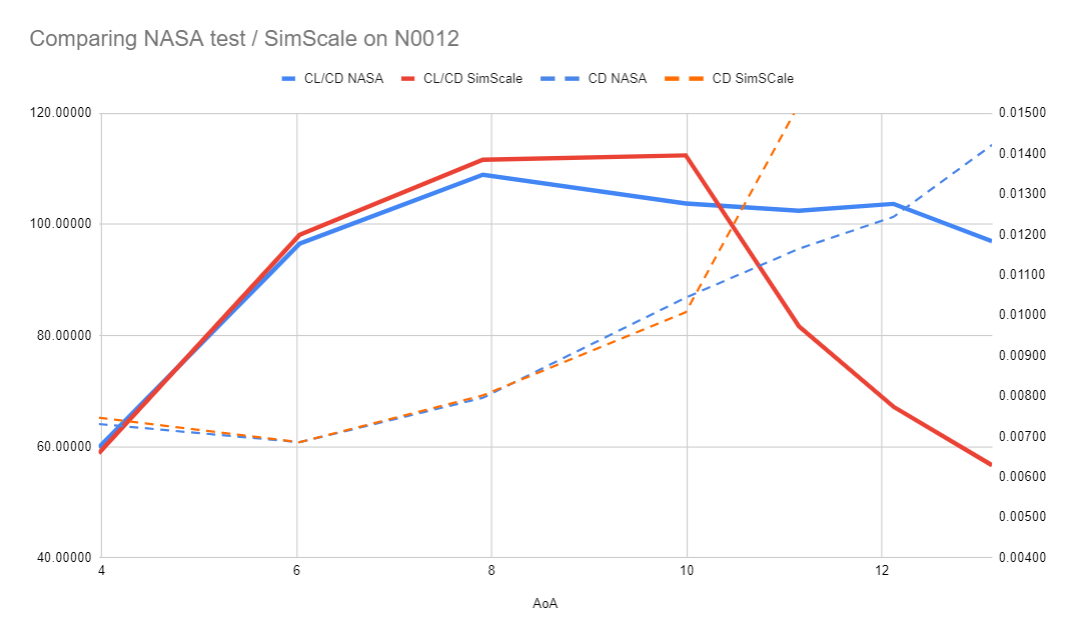
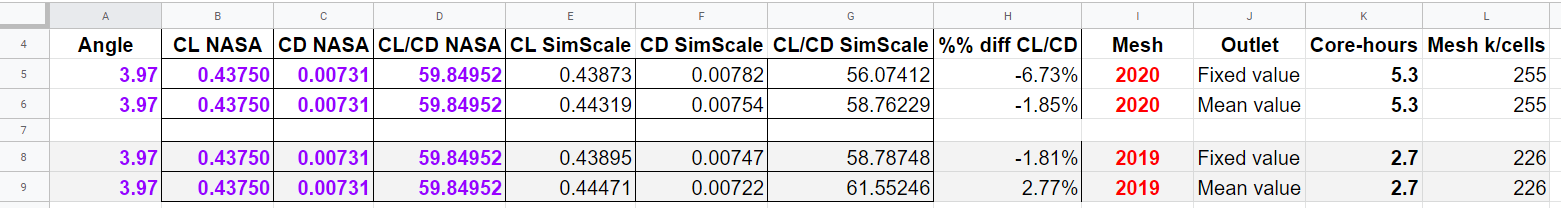
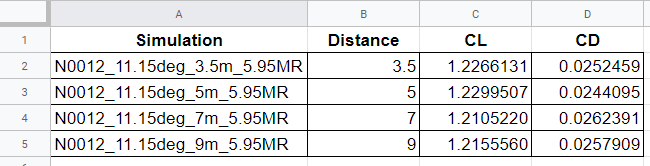
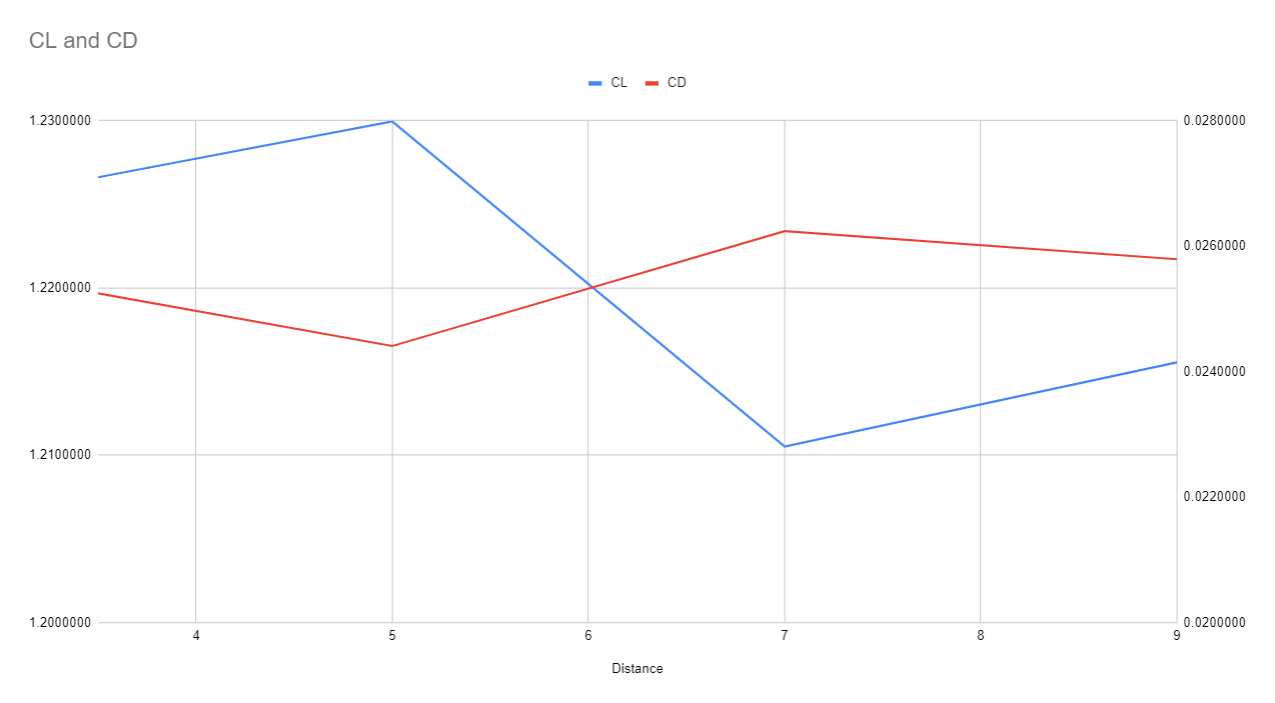
That way I was able to get the correct results for CD / CL on NACA0012 from 3.97 to 9.99 degrees:


AoA > 10 degrees were strangely off, surely for a valid reason but I could not, at that moment, find a way to modify my mesh in order to accommodate that ‘change of regime’.

At that moment I jumped to Ahmed body study using TET mesh and my 1 BL layer approach with ‘patches’ for high pressure gradient, with success.

Early this year @DaleKramer did a systematic study of 1 layer BL for HEX mesh and validated that way of applying Wall function.

Summing it up: it is not my poor knowledge of meshing / simulation that can be blamed. We had a ‘strange’ opportunity window last year to validate new TET mesh for CFD and I started to be convinced, that it really can be used on experimental metrics, with minimal setup and without heavy Numeric acrobatics. As a side effect of that new (2020) TET mesh modification, all my studies (NACA0012, Ahmed body, Tesla Trck) are invalidated (nobody could now reproduce those results). I think I will still make NACA0012 public, with explanation about my ‘exploration’ of tools and methods to make CFD simulation better.

For inspiration, I thank @DaleKramer and @Ricardopg for countless hours of discussions (frequently hot), pointers to documentation and tips.

Cheers,

Retsam

Hi @Retsam
oh no I didn’t mean to blame your knowledge at all. I’m very sorry if it came across that way. What you guys are doing here is really amazing, and I cannot emphasize enough how much you’re helping us by reporting all the problems you find. And if the results are wrong, it’s clearly something we’ve got to improve. Getting the lift and drag right for an airfoil is a very basic CFD problem and SimScale must be able to solve it without any doubt.

I think that the higher angles of attach will be more sensitive to correct behaviour of the turbulence in the boundary layer (especially the flow separation). It would be interesting to see if the turbulence boundary conditions (or the initial conditions, respectively) have any impact for the high-AoA regime.

How far off are the results for the 2019 validation projects?
Johannes

For a single sim run, I believe that Retsam showed the results differences between 2019 meshes and 2020 meshes in this previous post 16 of this topic.

His drag direction is +X and his lift direction is +Z (I believe that is a standard ‘aerodynamics’ axis orientation).

We see that 2020 pressure Drag is ~81% higher than 2019.

We see that 2020 viscous Drag is ~9% lower than 2019.

We see that this results in a 2020 CD that is ~65% higher than 2019.

.
.
.

We see that 2020 pressure Lift is ~1% lower than 2019.

We see that 2020 viscous Lift is ~9% lower than 2019.

We see that this results in a 2020 CL that is ~1% lower than 2019.

.
.
.

It may be interesting to see a 2020 version of the below 2019 chart of Post 18 in this topic, but you may have to run that yourself since we are all back to using HEX meshes now for our external aerodynamic projects.

2019 Meshing Chart:

image

1 Like

Hi guys
one of my colleagues took a look and gave me an important clue.
He hinted that the domain size plays an increasing role at high angles of attack. This is due to the fact that the wake region becomes larger, and imposing a constant pressure boundary condition right through a wake flow can introduce problems (because it is physically incorrect - the pressure isn’t constant).
NASA has also been aware of this problem.

NASA made the domain so big that the airfoil cannot be seen at this zoom level. There’s another interesting page which mentions the effect of the farfield boundary. According to NASA the farfield boundary “can particularly influence drag and lift levels at high lift conditions”. Furthermore “with smaller farfield boundary extents such as 30 c, the boundary influence on the forces is greater (especially for drag)” (emphasis mine).

So we ran the 11.15 degrees (which was badly off) again with a bigger flow domain


This is still not up to the standard of NASA but it gives the wake enough space to swim away freely without interacting with the outlet BC.

We used comparable mesh settings (fineness 4) and to ensure we get roughly the same fineness as in the project with the incorrect results, we imposed a region refinement. We used the standard mesher with the same layer refinements, and the same boundary conditions. We tried both hex and pure tet meshing.

The hex mesh gave the following values:

forces forces1 output:
sum of forces:
pressure : (0.76146998137 0.000159678961654 110.118009483)
viscous  : (0.203707401587 -0.00077078339203 -0.0322107856268)
porous   : (0 0 0)
sum of moments:
pressure : (0.880791955197 -0.0873637693236 -0.0063370913922)
viscous  : (-0.000224440531852 -0.00256230327931 -0.00155160496964)
porous   : (0 0 0)
forceCoeffs forceCoeffs2 output:
Cm    = -0.00103618864389
Cd    = 0.0111214224598
Cl    = 1.26848255642
Cl(f) = 0.633205089568
Cl(r) = 0.635277466856
faceSource faceSource30 output:
areaAverage(B1_TE1065) for U = (84.1164776596 -1.32189786544e-07     -1.18014982077)
areaAverage(B1_TE1065) for p = 0
areaAverage(B1_TE1065) for nut = 0.00114687930404
areaAverage(B1_TE1065) for k = 0.00382498200213
areaAverage(B1_TE1065) for omega = 3.32811613533

C_d = 0.01112 \\ C_l/C_d = 114.05

The tet mesh gives

Cm    = -0.000659972381821
Cd    = 0.0109396031182
Cl    = 1.27931757233
Cl(f) = 0.638998813784
Cl(r) = 0.640318758548

These values are in good agreement with the values according to NASA.
Hannes

2 Likes

Hi @jprobst: your last post is a very good contribution to defining a ‘good practice’ for airfoils simulation we tried to assemble! From above presented results both HEX and TET meshes are performing is similar manner and CL/CD is making sense.

You did make whole domain bigger, but moving Outlet BC far enough (we need to discover what is enough) would be possibly good enough. Moreover, you did use the same BC and same BL (1 layer covering y+ > 80, patched airfoil face with denser mesh on that path), which makes me believe that proposed geometry tweak + mesh + BL + BC + minimal Numerics tweaking can be used to check more experimental results and be valid for TET and HEX meshes.

NASA document you cited ( NASA has also been aware of this problem.) shows relatively small variations of CD between 30c and 100c and hints about ‘farfield Point Vortex (PV)’ correction. Extrapolating that graph to 5c would not bring that 70% more CD, but in any case, relation is clear.

Remaining question:

NACA0012 simulations for AoA 3.95 - 9.99 (moderate wake) with small domain and TET 2019 mesh were already correct. TET 2020 mesh would invalidate them (CD will be much off). Do you have explanation , please?

I was personally starting to run sensitivity tests on the distance of the outlet from the airfoil last October. This is when I found out that the new TET algo is limited to a max BMB domain size of 1km.

That, aside, are you saying that the significant difference between Results of 2019 TET meshes and 2020 TET meshes may ‘disappear’ if we did the following :question: :

  1. Do a sim run on a 2019 TET mesh, that had a large enough distance to the outlet face.
  2. Re-mesh that geometry with the same meshing parameters to obtain a 2020 TET mesh.
  3. Do a sim run with the same BCs etc on the new 2020 TET mesh.

I can see that if (and that is a BIG if) the Results of the sim runs in Steps 1 and 3 are ‘close’ to each other, then there MAY be no reason to further question whether the 2019 TET meshes or the 2020 TET meshes give more accurate results…

If we agree that it would be worth it, I think I can do Steps 1 to 3 with a fair bit of effort…

.
.
.

The above aside, could you provide a link to each of the HEX and TET sim runs that you say seem to be in good agreement with NASA :question:

Hi guys
sorry for the late reply. It’s been a busy week.
This is the link to the project: NACA0012 Airfoil study by Edoardo | SimScale
My opinion is that we can get good results for the airfoil with the current standard mesher, considering everything we found out in here. In summary

  • Keeping the boundary conditions, the boundary layer settings, numerics the same
  • Using a larger domain (in all directions) at least for the high angles of attack

I believe it is necessary to extend the domain in all directions because

  • In upstream direction we need to avoid interference with the velocity inlet BC
  • In downstream direction we need to avoid interference with the pressure outlet BC
  • And in the direction normal to the flow (“top and bottom”) because of the blockage effect of the airfoil

All of the effects mentioned above increase with higher AoA.

I agree with the procedure proposed by @DaleKramer.
Hex and tet should both give good results, although the hex will likely perform better.

Remaining question:
NACA0012 simulations for AoA 3.95 - 9.99 (moderate wake) with small domain and TET 2019 mesh were already correct. TET 2020 mesh would invalidate them (CD will be much off). Do you have explanation , please?

Just to help me understand, @Retsam are the results for low AoA with the current 2020 meshes incorrect? I can see in this post that the results for 11.15 AoA (relatively high) has been off (and I think we understand this now). Is it also the case for low AoA?

Johannes

@jprobst: I’ve just re-run NACA0012 simulation for low AoA (3.97) with mesh 2020 and produced a table with results. I added also the run with Outlet set to ‘Mean Value’, which, for small domain, has real impact.

You can see that mesh 2020, with Fixed value Outlet gives CL/CD -6.73% compared to NASA experiment. Mesh 2019 was 1.81% off.

Using Outlet Mean value is providing much better value, but both CD and CL are bigger than in experiment.

Mesh 2020 is ~ 10% bigger and simulation takes twice the time (too many processors involved?).


In preliminary tests of 2020 mesh, I can confirm that making domain longer brings nothing. As you said, domain should be scaled up in two dimensions. Making it thicker is counterproductive as well.

Making it thinner was calling for a disaster, as strong mesh irregularities emerge again and cell counts go to the sky (making it only .8 cm thick instead of 2 cm was just a mistake from OnShape, but I learned the ‘no-go’ for that quasi 2D mesh).

Higher angles (> 12 AoA) still do suffer (CD too high), but I did not finish my research of best, commun conditions for NACA0012 simulation.

Cheers,

Retsam

1 Like

Hi @Retsam
Thanks for sharing those results! Hmm, that’s interesting. So the fact that the outlet boundary condition has an impact on the results should in principle be an indication that the outlet is too close. However you also state that “making the domain longer brings nothing” - this surprises me. I can also not give a stringent explanation why the “2019” mesh gave a better C_l/C_d than the “2020” one. It may have been a coincidence, but I feel that it’s quite unlikely.
I can understand why making the domain thinner will increase the element count drastically. That’s because the mesher will refine elements in order to keep their aspect ratio below a certain limit.
If a better explanation for the unexpected behavior of the lift/drag values comes to mind I’ll let you know.
Johannes

Hi @jprobst,

Here are results of moving outlet wall from 3.5 m to 9 m distance, still keeping Fixed Value BC. It was a surprise indeed, but there is no clear relation of CD or CL with that distance.

image


Project, shared with support is here:

NACA0012_11.15deg