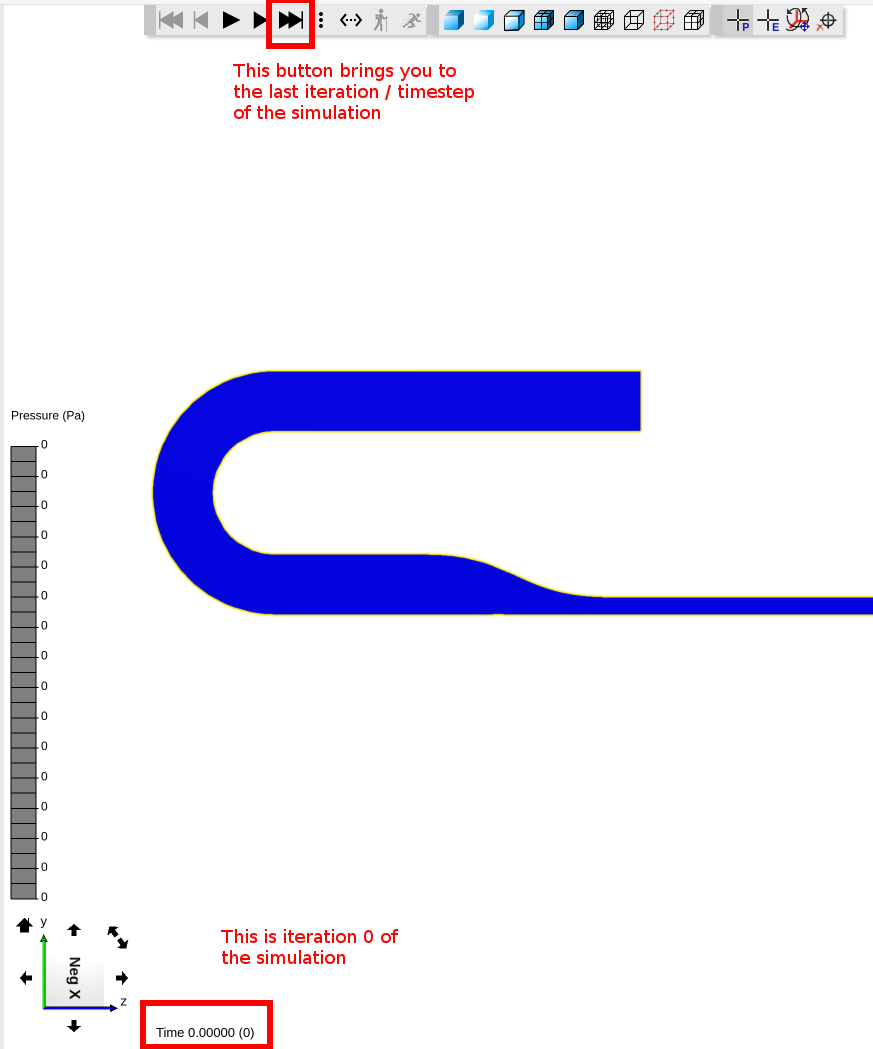
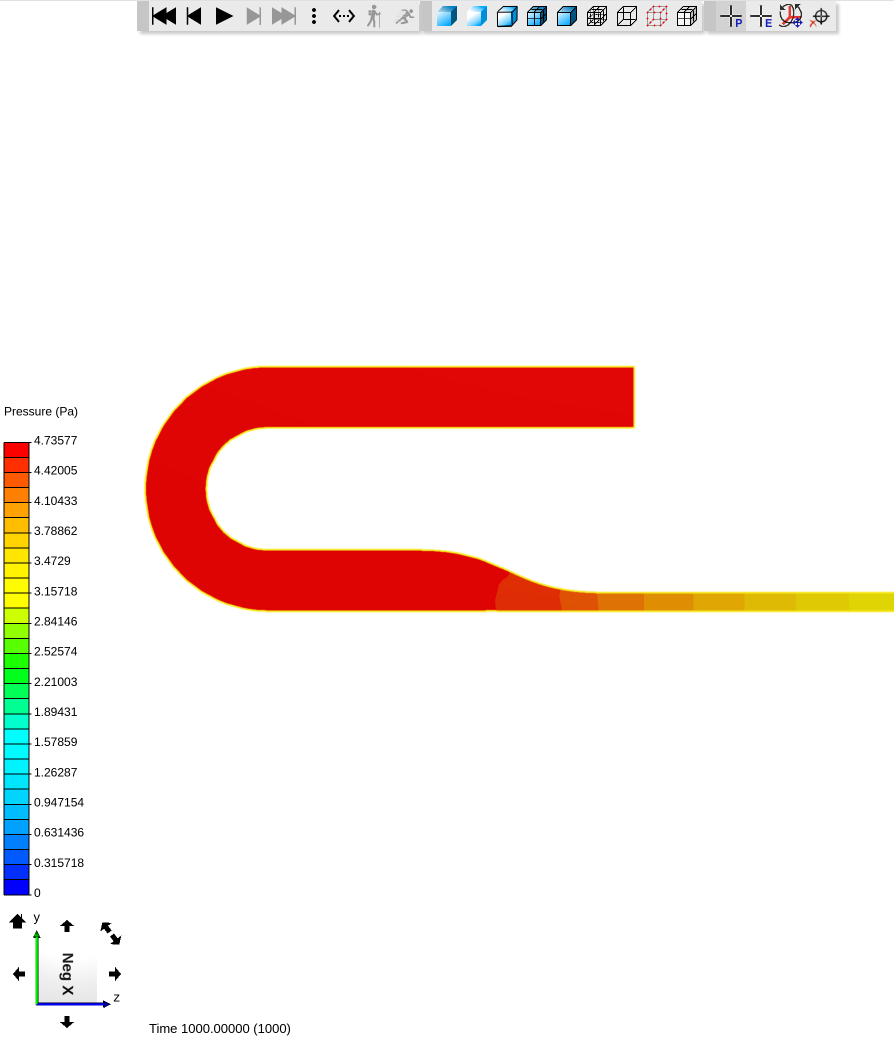
I have spent the past two days learning the tool using a few basic shapes. I’ve been successful running the evaluations with one exception. Namely, if I go back to review a prior Run, I am unable to see any Pressure visualization legend colors. The pressure legend suggests all pressures are 0, hence the color scale is all gray. If I go back and run a second simulation, without changing any setup, the Pressure results are visible once again.
Is this a bug in the software? Or am I somehow disabling the display?
Thanks, Scott