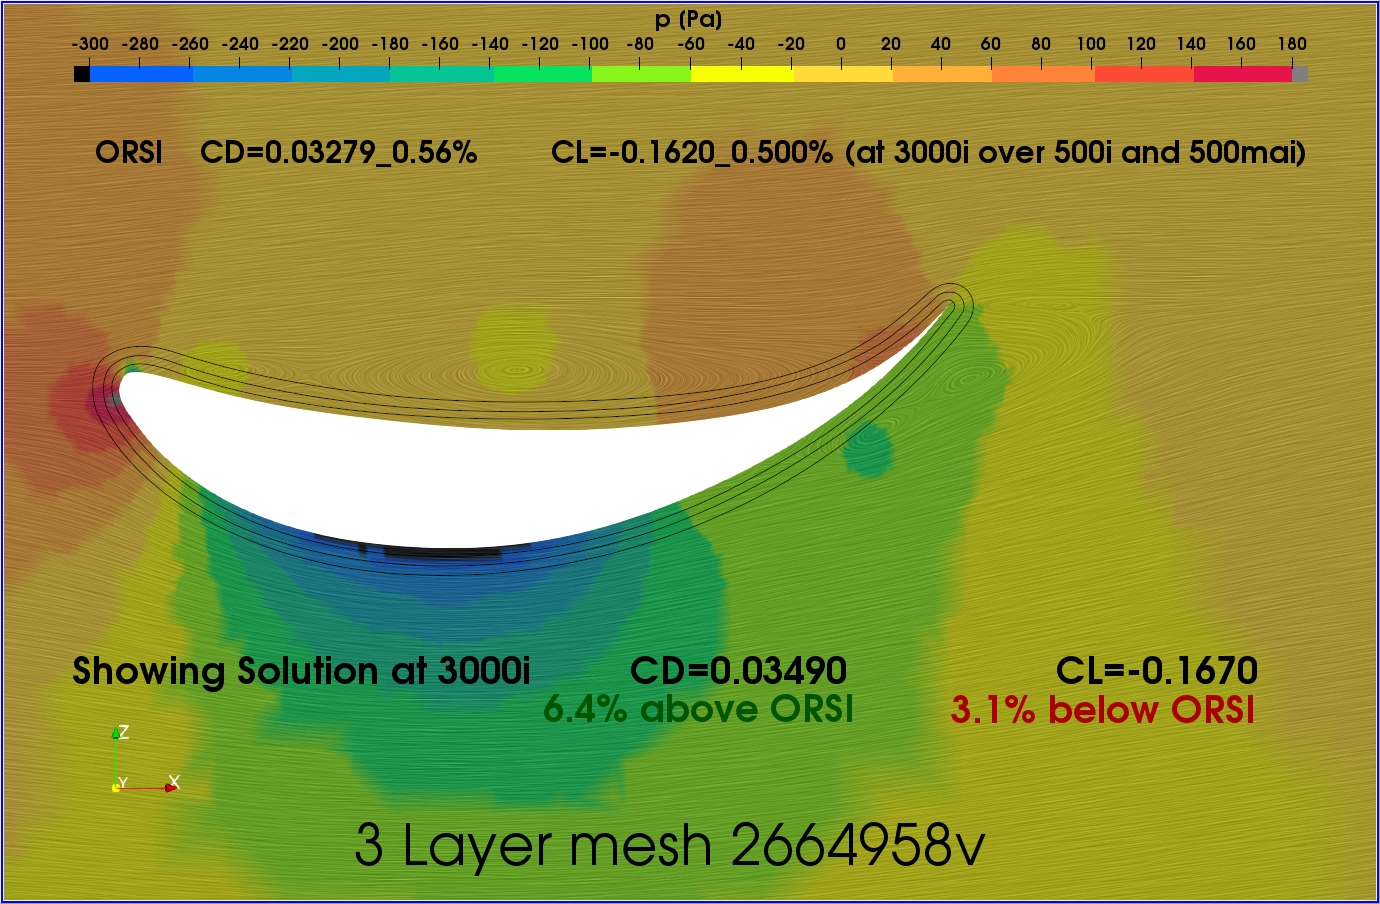
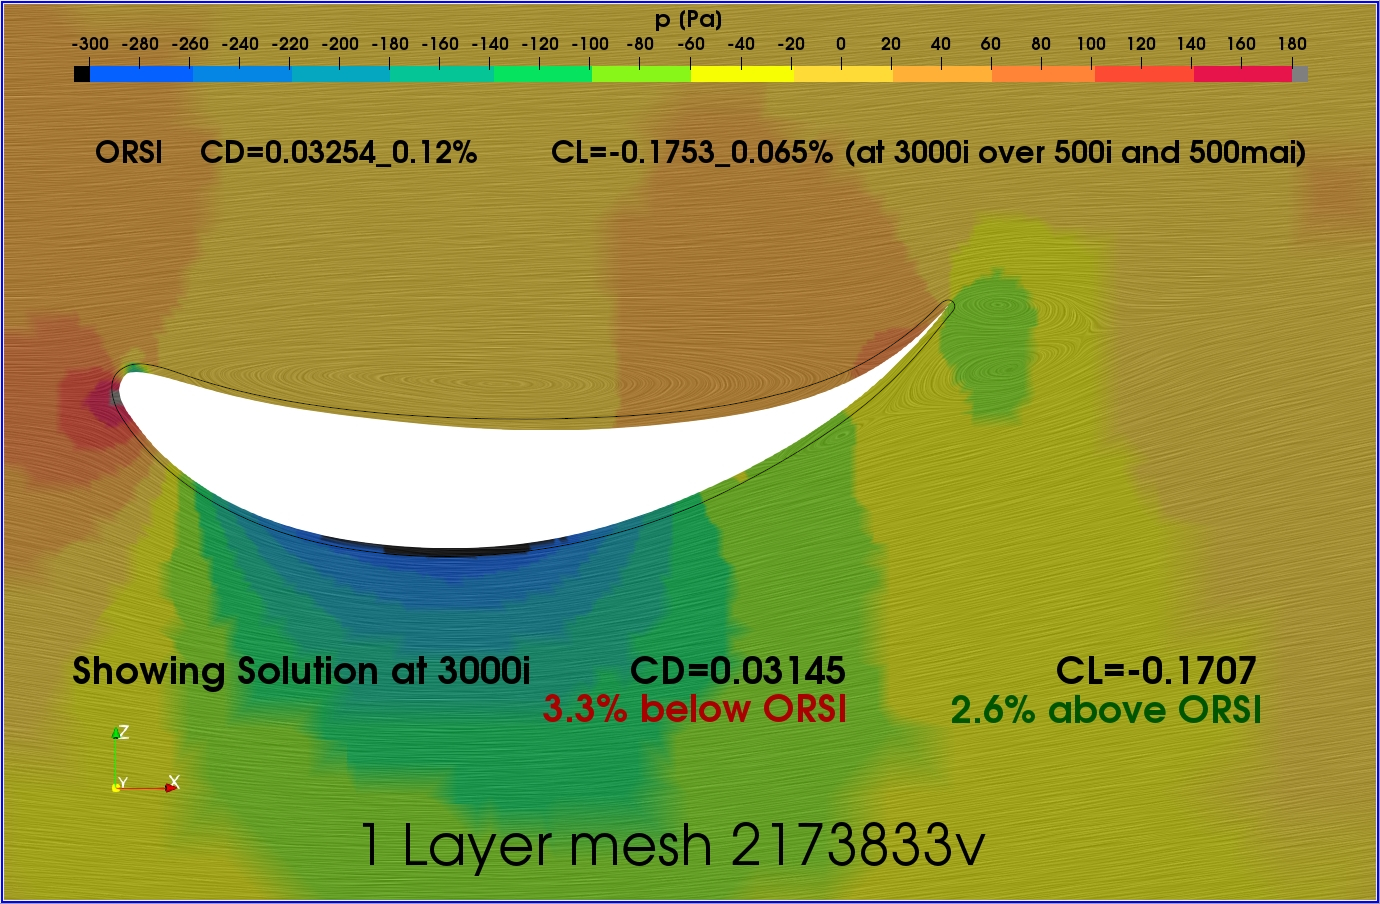
And for completeness, here are the 1 and 3 layer P plots:
.
.
BINGO ! ![]()
![]()
![]()
![]()
Look what I have, 1 and 3 layer plots where the solution sets are shown at their final iteration AND the solver log result values at the final iteration MATCH the ORSI value at that iteration (well at least within a measly 0.2% to 0.8 % of the ORSI value).
This means that the LIC flow patterns and all of the various parameter color plots are representative of the ORSI values, this is a huge advance ![]()
In fact, if there were ever an automatic simulation ‘Stop at a specified ORSI’ feature developed for the SimScale UI, the code for that can easily be written to stop when the solution set results match the requested ORSI ![]()
.
amazing, i will look deeper into this after work!
Here is my finished mesh of the full car. feel free to run your own sim, but as soon as im free i will be doing one. I noticed some small CAD changes i want to make but overall the 1 layer method looks solid!!! Im so pumped to see the Y+ Histogram results and i am also looking forward to trying your ORSI program for the first time. This sim run can be a benchmark for when to have the final iteration.
Also more good things
11 illegal cells!!!
14.6 million cells - this can be easily reworked to about 10 by reducing the high quality mesh box behind the rear wing!
Mesh looks great!
All credit for this goes to you Dale!
I am afraid my latest plots are bad news for 1 layer meshing though…
If we look at the ORSI CD difference between 1 and 3 layer meshes, the ORSI CD of the 1 layer mesh is only 0.8% lower than the 3 layer ORSI CD, which is sortof OK…
BUT, the ORSI CL difference shows that the 1 Layer mesh ORSI CL is a larger magnitude by 7.1%, this is NOT OK…
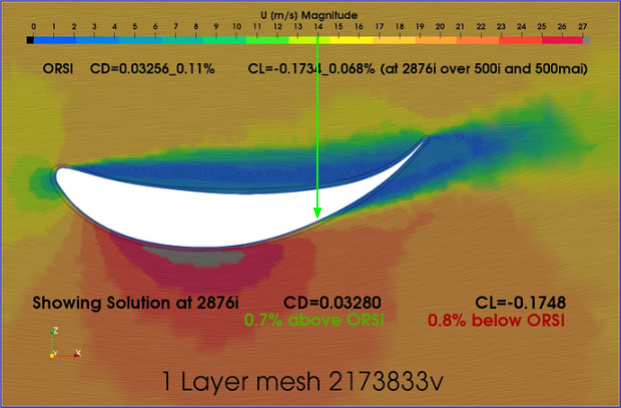
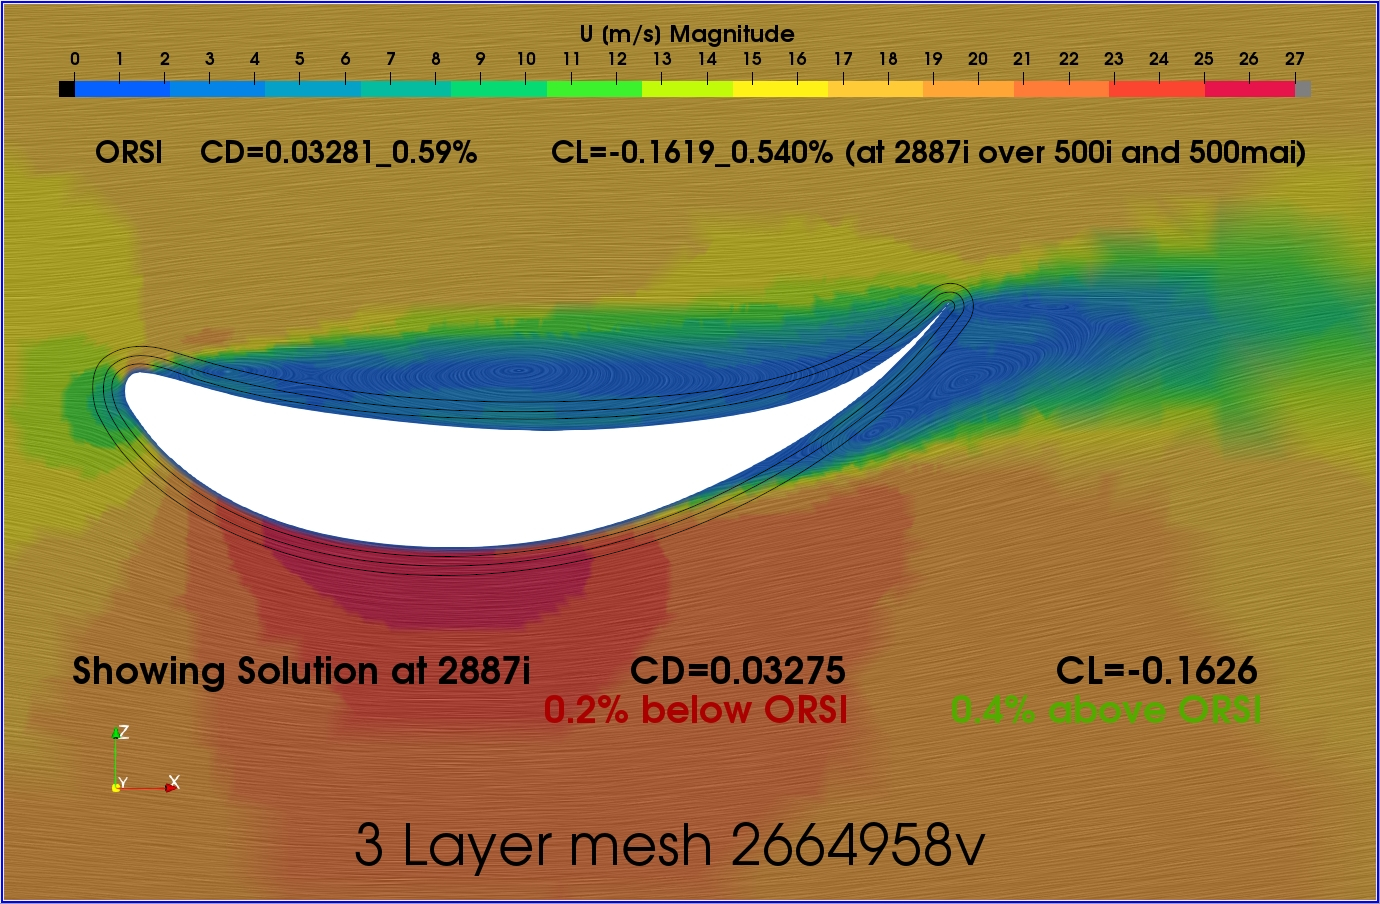
And in the U plot we can postulate that the higher speed air on the high pressure side of the airfoil is the cause of the significantly higher ORSI CL magnitude for the 1 layer mesh…
We can further postulate that this increased speed of the air, which is significantly inside the outer 2 layers of the 3 layer mesh, was ‘allowed’ to speed up because the solvers were not treating those HEX cells with same accuracy with regard to wall function calculations as the 3 layer prisms cells in that area were treated…
In effect, the air in the 1 layer mesh was allowed to speed up there because the air did not know it was so close to a surface that should have slowed it down by shear forces…
I can test these postulations by running a few more sims, with 0 layers to see if the air speeds up more in that area, and with 5 layers and 7 layers to see if we reach a point of diminishing returns (perhaps at the same expansion ratio as the 3 layers)…
I have some work to do 
Very impressive geometry file… Thanks for using STEP file…
That is a LOT of wings 
I am not sure the 1 layer mesh is your best option but it is for sure worth a sim run or two
I think maybe you should investigate splitting your wing surfaces where they get too close together to use 3 ‘wall function’ layers… On these faces that are now only near the tight areas, simply layer them to y+ 1 and then use full resolution wall functions on those faces when the sim is run… At 15M cells you can add quite a few at y+1 in those areas and still stay under or near 20M max cells… (I have never tried using wall and full res layering like that but it may work )
I have a few other jobs for today and if I get time I will likely work on the 0,1,3,5,7 layer study…
I assume that you are taking these results from the numerical data of the Cd and Cl plots where both sims are in the 1% zone using the ORSI. I am not entirely convinced that the difference is not ok due to the lack of a “control” sim. We do not know what the Cd or Cl should be for this profile and we are comparing results based off of a lot of variables. Building on this I have different views on what you say here:
If we are basing assumptions on visual data, then i would like to point out the following. You have made some nice pictures of each wing comparison between the 1 and 3 layer sims where both wing profiles are in the exact same place. This allows us to compare everything much easier. Taking the U magnitude scale at the top of the picture and using it as an unofficial marker, I have placed arrows at the point in each sim where the air separates from the low pressure side of the wing. As you can see the point of separation for the 1 layer sim is at 14, while the 3 layer sim is at 13. From what i know about aerodynamics, is that the low pressure side contributes more to overall lift (in our case downforce) then the high pressure side. This difference in separation points is what i would attribute most to the increase in downforce from the 1 layer sim. HOWEVER!! based on what Retsam mentioned about flow being “alive” these assumptions from the visual data are not valid and everything we have thought could be wrong
I do not know much at all about how the solvers treat HEX vs BL cells. I would agree that this could be partially if not entirely the reason why we have a difference in CL. I hope that your new method of validating this will work and will help to clarify how accurate each result is.
No I should have preceded those CL and CD acronyms in paragraphs 2 and 3 with ORSI. (I just edited post accordingly).
I believe that when we are looking at relative differences in sim results of two simulations that use ‘best practices’ (other than the practice under review), we do not need a control set of results to determine if 1 layer gives the same results as 3 layers… The ONLY metric needed for that is whether the give very close to the same results… I am NOT looking to determine whether the 1 layer or the 3 layer give ‘better’ results, for that we WOULD need a control… So, ONLY if both ORSI CL and ORSI CD were close could we say that 1 layer is OK to use… Since they are 7% ORSI CL different, 1 layer is out for now until someone might prove that there is universal proof that 1 layer is always closer to reality than 3 (which I never expected to happen, I only hoped they were closer than 7% ![]() )…
)…
I do not agree with that theory, the difference in integrated pressure between the low and high areas (with respect to far field domain pressure) IS the overall lift… How can one be more important that the other?
I strongly disagree that anything about viewing results from iteration to iteration in a static simulation can be looked at as ‘live’ flow changes… A static simulation is a series of guesses as to what a snapshot in time of the variables in the domain might look like while trying to meet all the boundary conditions. The solvers are guessing at what might be a state that meets all of the boundary conditions of the sim, early iterations are just bad guesses and in no way represent valid flow states… Only when near the end of a sim run when residuals are low and the force/coeff results may be stable or oscillating about a stable value can we say that the solvers are giving us their best guesses and we can stop the simulation. When the results are oscillating around a stable result, it is obvious to me that the best results would be at an iteration where the current results are equal to that stable value which they are oscillating around…
Ok so does this mean that a 3 layer BL is best practice and we are seeing if a 1 layer had close enough results to be validly used.
Now this leads to what about a 2 layer BL sim? I guess this is what you are talking about with a 0,2,5,7 layer test. Now I am wondering what makes 3 layer a standard? My whole concept of this is that we are trying to capture data in the log-law region for our boundary layers. The data captured from the 1 layer sim, based on the Y+ histogram, says all our values are within the 3-300 range. HOWEVER, we are using one cell for this, which means one data point per distance along the wing surface. Using 3 layers allows for 3 data points per distance along the same surface. Is this why these results are considered more accurate? because we more data points to confirm what is happening a specific area?
I should clarify my meaning. by contributing more to downforce, i am saying that one side is clearly more efficient at producing this difference of high and low pressure that is lift. This is shown in many designs, such as swan neck rear wing for race cars. Basically the low pressure side is able to “suck” more air to create this pressure difference then the high pressure side is able to “push” the wing down. They both definitely codependent, but there is a reason why all the undersides of race car wings are very smooth and free of turbulent devices or Attachement points.
P.S. I am by no means implying that i know better in this area, I am just going by what i have formulated as my general rule for racecar aero.
I think I said ‘more accepted’ and because Dylan says so ![]() and he has verified that his CFD sims on the Drivaer are within 1% of experimental… I think I have PM from him saying mostly 3 are good for him…
and he has verified that his CFD sims on the Drivaer are within 1% of experimental… I think I have PM from him saying mostly 3 are good for him…
Because prism cells are better shaped to calculate the BL shear zone… I hope you mean ‘from’ and not ‘along’. The number along the surface is determined by level of surface refinement…
And I believe the reason for that is to make sure the air stays attached to the surface as laminar flow for as far back a possible on the low pressure surface, not because suction has more power than pressure, after all you can only ever have a maximum of about 15psi for suction while pressure side is virtually unlimited pressure…
LMAO hahaha
yes I did. At the same point along the wing surface, 1 layer sim has one data point, while 3 layer has 3, 4 layer has 4 etc…
Ah yes i forgot about this. Low pressure side has a chance to separate and cause drag, High pressure not as much, SO i should change my statement to "Low pressure side is more sensitive to separation, therefore it is more important that this area is accurately calculated/simulated. As my separation observation In this post shows.
Thanks for the clarification!
So what we have done so far is a great study and has helped me immensely in getting accurate results. However, I feel that i need to start moving on from the CFD accuracy and continue the thesis. i do not want to get sucked into a never ending loop of tests and not get the rest of my work done. I will do a couple full car trial meshes with 1 and 3 layer BLs but i need to get a constant simulation setup dialed in to use across all tests. I am more then willing to do a few more wing only tests but i need to have my deadline for a finished method by the end of january.
Good choice!
I am continuing with the 01357 layer test, looks like 1 layer is not fully out the door…
Also, I may try combining Full and Wall resolution surfaces areas on the wing surfaces so that the wings can be 3 layered all over (including the gap area). The benefit of that would be that setup would use more ‘accepted’ practices…
I am getting sucked back in … at least for now
I have decided to do a quick test of the 1 layer approach. We tested the 1 layer at 3.4mm cell size and determined that this fit almost all Y+ area into the 30-300 region. However, we did not optimize this one layer. The 3.4mm comes from the result of our average Y+ in the histogram of 105, which is the cell centroid at 1.6mm from your post HERE
I am now doing this 1 layer optimization at 3.2, 3.0, 2.8, and 2.6 cell sizes. Then the Y+ histogram should give us our exact minimum 1st layer that falls within a reasonable 30-300 range. If possible, I can use this as the starting layer for a 3 layer BL that will hopefully fit in the slot gaps of the elements
Don’t be afraid to extend that to a 20-300 range, I think that will help with this issue and I think it is still pretty bulletproof wrt best practices…
And don’t forget that the added preciseness you are seeking by your 3.2-2.6mm test may be lost when the wings are placed on the car, or are you doing that test on the full vehicle 
Yes If i find that the smaller 1 layer cells dont have too much in the 20 range i will leave it. having 5% of the Y+ area in a region that is unwanted is a value i can live with. Especially because i dont need SUPER high accuracy on this.
Also i am getting into porous media and now a MRF fan simulation. Checking the Y+ with the 1 layer 3.4mm method on the fan blades now as well haha
Also before i run these simulations. Should i stop the iterations (timestep) at 2876 for the solution? I want to compare to your ORSI data. Is there another time ORSI is at 1% to reduce sim time or is this when you manually stopped it?
Give me link so I can look at CSV with ORSI…
I didnt set up Y+ in result control for this yet
Sorry of the one that 2876 was determined for… I know I have it somewhere but I am lazy remember…
Showing Solution at 2876i … this is the timestep you stopped it at correct?